Tanzania: Ecosystems

Climate change is expected to have a significant influence on the ecology and distribution of tropical ecosystems, though the magnitude, rate and direction of these changes are uncertain [29]. With rising temperatures and increased frequency and intensity of droughts, wetlands and riverine systems are increasingly at risk of being converted to other ecosystems with plant populations being succeeded and animals losing habitats. Increased temperatures and droughts can also impact succession in forest systems while concurrently increasing the risk of invasive species, all of which affect ecosystems. In addition to these climate drivers, low agricultural productivity and population growth might motivate further agricultural expansion resulting in increased deforestation, land degradation and forest fires all of which will impact animal and plant biodiversity.
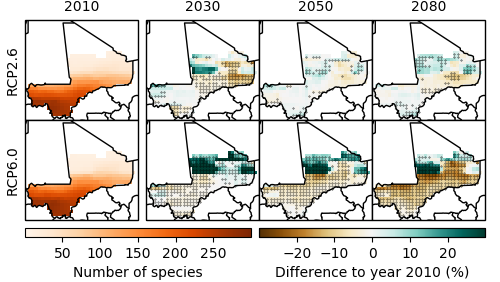
Species richness

Figure 16: Projections of the aggregate number of amphibian, bird and mammal species for Tanzania for different GHG emissions scenarios.

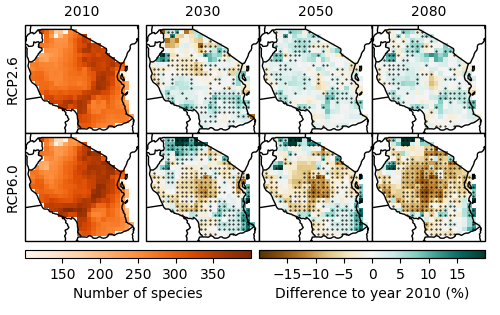
Model projections of species richness (including amphibians, birds and mammals) and tree cover for Tanzania are shown in Figure 16 and 17, respectively. Projections of the number of animal species show a strong decrease by 2080 (Figure 16): Under RCP6.0, most models agree that the number of animal species will decrease by up to 15 %, especially in central Tanzania, while other areas in northern and eastern Tanzania are projected to gain in the number of species.
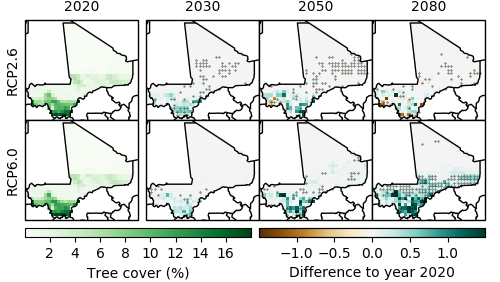
Tree cover

Figure 17: Tree cover projections for Tanzania for different GHG emissions scenarios.

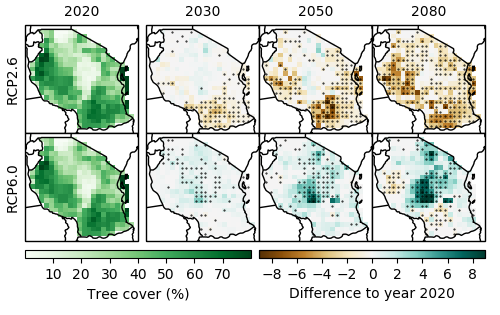
With regard to tree cover, median model projections agree on a decrease by 2 % in Tanzania under RCP 2.6 and an increase of up to 9 % in central Tanzania under RCP6.0 by 2080 (Figure 17). The latter can be explained by increasing precipitation amounts in this region.

Although these results paint a rather positive picture for climate change impacts on tree cover, it is important to keep in mind that model projections exclude any impacts on biodiversity loss from human activities such as land use, which have been responsible for significant losses of global biodiversity in the past, and which are expected to remain its main driver in the future [30]. For example, extensive land-use change in the densely vegetated foothills of Mount Kilimanjaro accounted for an expansion of cultivated land from 54 % in 1973 to 63 % in 2000, all at the expense of natural vegetation [31]. Overall, Tanzania lost 2.51 million hectares of tree cover from 2001 to 2019, which is equivalent to a decrease of 9.5 % [32].

References

[29] T. M. Shanahan, K. A. Hughen, N. P. McKay, J. T. Overpeck, C. A. Scholz, W. D. Gosling, C. S. Miller, J. A. Peck, J. W. King, and C. W. Heil, “CO2 and Fire Influence Tropical Ecosystem Stability in Response to Climate Change,” Nat. Publ. Gr., no. July, pp. 1–8, 2016.
[30] IPBES, “Report of the Plenary of the Intergovernmental Science-Policy Platform on Biodiversity and Ecosystem Services on the Work of Its Seventh Session,” n.p., 2019.
[31] B. S. Misana, C. Sokoni, and M. J. Mbonile, “Land-Use / Cover Changes and Their Drivers on the Slopes of Mount Kilimanjaro, Tanzania,” J. Geogr. Reg. Plan., vol. 5, no. 6, pp. 151–164, 2012.
[32] Global Forest Watch, “Tanzania.” Online available: www.globalforestwatch.org [Accessed: 10-Jul-2020].

Tanzania: Infrastructure

Climate change is expected to significantly affect Tanzania’s infrastructure sector through extreme weather events. High precipitation amounts can lead to flooding of transport infrastructure, especially in the coastal areas, while high temperatures can cause roads, bridges and protective structures to develop cracks and degrade more quickly. This will require earlier replacement and lead to higher maintenance and replacement costs. Tanzania’s transport sector is dominated by road transport, which accounts for 80 % of passenger traffic and 95 % of freight traffic [24]. Transport infrastructure is very vulnerable to extreme weather events, yet essential for social, economic and agricultural livelihoods. Roads serve communities to trade goods and access healthcare, education, credit as well as other services, especially in rural and remote areas. Overall, Tanzania has one of the lowest paved-road densities in Africa, relying on few major roads [24]. Thus, investments will have to be made to build climate-resilient road networks.

Extreme weather events will also have devastating effects on human settlements and economic production sites, especially in urban areas with high population densities such as Dar es Salaam or Mwanza. Informal settlements are particularly vulnerable to extreme weather events: Makeshift homes are often built in unstable geographical locations including riverbanks and coastal areas, where flooding can lead to loss of housing, contamination of water, injury or death. Dwellers usually have low adaptive capacity to respond to such events due to high levels of poverty and lack of risk-reducing infrastructures. The flooding-poverty nexus is particularly strong in Dar es Salaam, where many households experience floods on an annual basis and even during average precipitation events [25]. In April 2018, 11 976 people in Dar es Salaam have been affected by a flood event [26]. 42 houses and 21 latrines collapsed, and 342 houses were severely damaged. Flooding and droughts will also affect hydropower generation: Tanzania is planning to increase its hydropower capacity from 0.5 gigawatts in 2015 to a planned volume of 3.4 gigawatts in 2030. However, variability in precipitation and climatic conditions could severely affect river levels and disrupt hydropower generation [27].

Despite the risk of infrastructure damage being likely to increase, precise predictions of the specific location and extent of exposure are difficult to make. For example, projections of river flooding are subject to substantial modelling uncertainty, largely due to the uncertainty of future projections of precipitation amounts and their spatial distribution, affecting flood occurrence (see also Figure 5). In Tanzania, projections show no change in the exposure of major roads to river floods under RCP2.6 and a slight increase under RCP6.0 (Figure 13). In 2000, 1.3 % of major roads were exposed to river floods at least once a year, while by 2080, this value is projected to slightly increase to 1.5 % under RCP6.0. In a similar way, exposure of urban land area to river floods is projected to increase only under RCP6.0, from 0.11 % in 2000 to 0.24 % in 2080 (Figure 14).

Figure 13: Projections of major roads exposed to river floods at least once a year for Tanzania for different GHG emissions scenarios.
Figure 14: Projections of urban land area exposed to river floods at least once a year for Tanzania for different GHG emissions scenarios.

The exposure of the GDP to heatwaves is projected to increase from around 2 % in 2000 to 6 % (RCP2.6) and 16 % (RCP6.0) by the end of the century (Figure 15). It is recommended that policy makers start identifying heat-sensitive economic production sites and activities, and integrating climate adaptation strategies such as improved solar-powered cooling systems, “cool roof” isolation materials or switching the operating hours from day to night [28].

Figure 15: Exposure of GDP in Tanzania to heatwaves for different GHG emissions scenarios.

References

[24] United Republic of Tanzania Vice President’s Office, “National Climate Change Strategy,” Dodoma, Tanzania, 2012.
[25] T. Sakijege, J. Lupala, and S. Sheuya, “Flooding, Flood Risks and Coping Strategies in Urban Informal Residential Areas: The Case of Keko Machungwa, Dar Es Salaam, Tanzania,” Jamba J. Disaster Risk Stud., vol. 4, no. 1, pp. 1–10, 2012.
[26] IFRC, “Emergency Plan of Action Final Report: Tanzania Floods,” Geneva, Switzerland, 2019.
[27] D. Conway, P. Curran, and K. E. Gannon, “Policy Brief: Climate Risks to Hydropower Supply in Eastern and Southern Africa,” London and Leeds, UK, 2018.
[28] M. Dabaieh, O. Wanas, M. A. Hegazy, and E. Johansson, “Reducing Cooling Demands in a Hot Dry Climate: A Simulation Study for Non-Insulated Passive Cool Roof Thermal Performance in Residential Buildings,” Energy Build., vol. 89, pp. 142–152, 2015.

Tanzania: Agriculture

Smallholder farmers in Tanzania are increasingly challenged by the uncertainty and variability of weather caused by climate change [19], [20]. Since crops are predominantly rainfed, they depend on water availability from precipitation and are prone to drought. However, the length and intensity of the rainy season is becoming increasingly unpredictable and the use of irrigation remains limited. The national crop land suitable for irrigation is estimated at 29.4 million ha [7]. Currently, only 1.5 % of this potential is irrigated. However, Tanzania has been investing in irrigation and is planning to almost triple its total irrigated area to 1.24 million ha by 2035 [21]. This expansion is motivated by hopes to increase the productivity of rice, which, along with maize, is the main irrigated crop in Tanzania [21].

Crop land exposure to drought

Figure 11: Projections of crop land area exposed to drought at least once a year for Tanzania for different GHG emissions scenarios.

Currently, the high uncertainty of projections regarding water availability (Figure 10) translates into high uncertainty of drought projections (Figure 11). According to the median over all models employed for this analysis, the national crop land area exposed to at least one drought per year will increase by a factor of five in response to global warming. Under RCP6.0, the likely range of drought exposure of the national crop land area per year widens from 0.05–1.0 % in 2000 to 0.5–6.2 % in 2080. The very likely range widens from 0.01–1.8 % in 2000 to 0.2–10.1 % in 2080. This means that most models project a significant increase in drought exposure over this time period.

Crop yield projections

Figure 12: Projections of crop yield changes for major staple crops in Tanzania for different GHG emissions scenarios assuming constant land use and agricultural management, relative to the year 2000.

In terms of yield projections, millet, sorghum, rice, groundnuts and cassava are projected to gain from climate change (Figure 12)5. Under RCP6.0, crop yields are projected to increase by 22 % for millet and sorghum, 18 % for rice, 22 % for groundnuts and 31 % for cassava by 2080 relative to the year 2000. These positive results can be ascribed to the CO2 fertilisation effect, which benefits plant growth. Rice, groundnuts and cassava are so-called C3 plants, which follow a different metabolic pathway than maize (C4 plant), and thus benefit more from the CO2 fertilisation effects under higher concentration pathways. Maize yields are projected to slightly decrease under RCP2.6 and remain at current levels under RCP6.0. The decrease under RCP2.6 can be explained by non-temperature related parameters such as changes in precipitation patterns, while the projections for RCP6.0 can be explained by CO2 fertilisation. Regional climate variability will likely cause crop yields to increase in some areas, while simultaneously decreasing in others.

Overall, adaptation strategies such as switching to high-yielding improved varieties in climate change sensitive crops should be considered, yet carefully weighed against adverse outcomes, such as a resulting decline of agro-biodiversity and a loss of local crop types.

5 Modelling data is available for a selected number of crops only. Hence, the crops listed on page 2 may differ. Maize, millet and sorghum are modelled for all countries.

References

[19] P. M. Luhunga, A. L. Kijazi, L. Chang’a, A. Kondowe, H. Ng’ongolo, and H. Mtongori, “Climate Change Projections for Tanzania Based on High-Resolution Regional Climate Models From the Coordinated Regional Climate Downscaling Experiment (CORDEX)-Africa,” Front. Environ. Sci., vol. 6, no. October, pp. 1–20, 2018.
[20] P. Rowhani, D. B. Lobell, M. Linderman, and N. Ramankutty, “Climate Variability and Crop Production in Tanzania,” Agric. For. Meteorol., vol. 151, no. 4, pp. 449–460, 2011.
[21] JICA, “The Project on the Revision of National Irrigation Master Plan in the United Republic of Tanzania,” Tokyo, Japan, 2018.

Tanzania: Water resources

Water shortage has been an issue in Tanzania for decades and is likely to continue in the future. Several studies show that climatic changes in Tanzania have resulted in a decrease in total precipitation, a shift of the onset of the rainy season and an increase in the frequency and duration of droughts [14][15]. These changes have materialised, for example, in the extreme decrease of water levels of Lake Victoria and Lake Tanganyika, and the 7-km recession of Lake Rukwa over the past 50 years [16]. Additional challenges related to water availability include an increasing demand associated with agricultural expansion and intensification and with the domestic needs of a growing population [17]. Unreliable precipitation in the highland areas has been the main driver for shifting agricultural production towards lower wetland areas, which offer comparatively fertile soils and year-round water availability [18]. However, the conversion of wetlands in favour of agricultural production has negative trade-off effects on affected ecosystems.

Per capita water availability

Figure 9: Projections of water availability from precipitation per capita and year with (A) national population held constant at year 2000 level and (B) changing population in line with SSP2 projections for different GHG emissions scenarios, relative to the year 2000.

Current projections of water availability in Tanzania display high uncertainty under both GHG emissions scenarios. Assuming a constant population level, multi-model median projections suggest no change in per capita water availability over Tanzania by the end of the century under RCP6.0 and only a slight decrease under RCP2.6 (Figure 9A). Yet, when accounting for population growth according to SSP2 projections4, per capita water availability for Tanzania is projected to decline by 76 % under both RCPs by 2080 relative to the year 2000 (Figure 9B). While this decline is primarily driven by population growth rather than climate change, it highlights the urgency to invest in water saving measures and technologies for future water consumption.

Spatial distribution of water availability

Figure 10: Water availability from precipitation (runoff) projections for Tanzania for different GHG emissions scenarios.

Projections of future water availability from precipitation vary depending on the region and scenario (Figure 10). Under RCP2.6, water availability will decrease by up to 25 % in northern and south-eastern Tanzania, with most models agreeing on this trend. The picture for RCP6.0 is different: The model agreement on the direction of change is low for all parts of Tanzania.

4 Shared Socio-economic Pathways (SSPs) outline a narrative of potential global futures, including estimates of broad characteristics such as country level population, GDP or rate of urbanisation. Five different SSPs outline future realities according to a combination of high and low future socio-economic challenges for mitigation and adaptation. SSP2 represents the “middle of the road”-pathway.

References

[14] U. Adhikari, A. P. Nejadhashemi, M. R. Herman, and J. P. Messina, “Multiscale Assessment of the Impacts of Climate Change on Water Resources in Tanzania,” J. Hydrol. Eng., vol. 22, no. 2, pp. 1–13, 2017.
[15] A. E. Majule and M. A. Lema, “Impacts of Climate Change, Variability and Adaptation Strategies on Agriculture in Semi Arid Areas of Tanzania: The Case of Manyoni District in Singida Region, Tanzania,” African J. Environ. Sci. Technol., vol. 3, no. 8, pp. 206–218, 2009.
[16] Vice President’s Office Division of Environment, “National Adaptation Programme of Action (NAPA),” Dodoma, Tanzania, 2007.
[17] K. Velempini, T. A. Smucker, and K. R. Clem, “Community-Based Adaptation to Climate Variability and Change: Mapping and Assessment of Water Resource Management Challenges in the North Pare Highlands, Tanzania,” African Geogr. Rev., vol. 37, no. 1, pp. 30–48, 2018.
[18] R. Y. M. Kangalawe, “Climate Change Impacts on Water Resource Management and Community Livelihoods in the Southern Highlands of Tanzania,” Clim. Dev., vol. 9, no. 3, pp. 191–201, 2017.

Tanzania: Climate

Temperature

Figure 2: Air temperature projections for Tanzania for different GHG emissions scenarios.3

In response to increasing greenhouse gas (GHG) concentrations, air temperature over Tanzania is projected to rise (Figure 2). Compared to pre-industrial levels, median climate model temperature increases over Tanzania amount to approximately 1.4 °C in 2030, 1.7 °C in 2050 and 1.6 °C in 2080 under the low emissions scenario RCP2.6. Under the medium / high emissions scenario RCP6.0, median climate model temperature increases amount to 1.4 °C in 2030, 1.7 °C in 2050 and 2.5 °C in 2080.

Very hot days

Projections of the annual number of very hot days (daily maximum temperature above 35 °C) for Tanzania for different GHG emissions scenarios.

In line with rising mean annual temperatures, the annual number of very hot days (days with daily maximum temperature above 35 °C) is projected to rise substantially and with high certainty, in particular over eastern Tanzania (Figure 3). Under the medium / high emissions scenario RCP6.0, the multi-model median, averaged over the whole country, projects 6 more very hot days per year in 2030 than in 2000, 11 more in 2050 and 22 more in 2080. In some parts, especially in eastern Tanzania, this amounts to about 100 days per year by 2080.

Sea level rise

Figure 4: Projections for sea level rise off the coast of Tanzania for different GHG emissions scenarios, relative to the year 2000.

In response to globally increasing temperatures, the sea level off the coast of Tanzania is projected to rise (Figure 4). Until 2050, similar sea levels are projected under both emissions scenarios. Under RCP6.0 and compared to year 2000 levels, the median climate model projects a sea level rise by 11 cm in 2030, 21 cm in 2050 and 41 cm in 2080. This threatens Tanzania’s coastal communities and may cause saline intrusion in coastal waterways and groundwater reservoirs, rendering water unusable for domestic use and harming biodiversity.

Precipitation

Figure 5: Annual mean precipitation projections for Tanzania for different GHG emissions scenarios, relative to the year 2000.

Future projections of precipitation are less certain than projections of temperature change due to high natural year-to-year variability (Figure 5). Out of the three climate models underlying this analysis, none of the models projects a clear trend in mean annual precipitation over Tanzania under RCP6.0. Under RCP2.6, two models project a decrease, while for one model, the trend remains unclear. Median model projections for RCP2.6 show a decrease in precipitation by 42 mm until 2080, while median model projections for RCP6.0 show almost no change in precipitation by 2080 compared to year 2000.

Heavy precipitation events

Figure 6: Projections of the number of days with heavy precipitation over Tanzania for different GHG emissions scenarios, relative to the year 2000.

In response to global warming, heavy precipitation events are expected to become more intense in many parts of the world due to the increased water vapour holding capacity of a warmer atmosphere. At the same time, the number of days with heavy precipitation events is expected to increase. This tendency is also found in climate projections for Tanzania (Figure 6), with climate models projecting a slight increase in the number of days with heavy precipitation, from 8 days per year in 2000 to 9 days per year in 2080 under RCP6.0. Under RCP2.6, the number of days with heavy precipitation does not change.

Soil moisture

Figure 7: Soil moisture projections for Tanzania for different GHG emissions scenarios, relative to the year 2000.

Soil moisture is an important indicator for drought conditions. In addition to soil parameters and management, it depends on both precipitation and evapotranspiration and therefore also on temperature, as higher temperatures translate into higher potential evapotranspiration. Annual mean top 1-m soil moisture projections for Tanzania show a decrease of 4 % under both RCP2.6 and RCP6.0 by 2080 compared to the year 2000 (Figure 7). However, looking at the different models underlying this analysis, there is large year-to-year variability and modelling uncertainty, which makes it difficult to identify a clear trend.

Potential evapotranspiration

Figure 8: Potential evapotranspiration projections for Tanzania for different GHG emissions scenarios, relative to the year 2000.

Potential evapotranspiration is the amount of water that would be evaporated and transpired if sufficient water was available at and below the land surface. Since warmer air can hold more water vapour, it is expected that global warming will increase potential evapotranspiration in most regions of the world. In line with this expectation, hydrological projections for Tanzania indicate a stronger and more continuous rise of potential evapotranspiration under RCP6.0 than under RCP2.6 (Figure 8). Under RCP6.0, potential evapotranspiration is projected to increase by 2.7 % in 2030, 3.8 % in 2050 and 7.1 % in 2080 compared to year 2000 levels.

3 Changes are expressed relative to year 1876 temperature levels using the multi-model median temperature change from 1876 to 2000 as a proxy for the observed historical warming over that time period.

PIK team participated in expert panel at Climate Dialogues 2020

The panel took place on December 1 and was part of the event “Informal joint Presidency and incoming-Presidency technical event: Rising to the challenge of climate risk”. In addition to Christoph Gornott from PIK, panelists included Srilata Kammila from UNDP and Muhammad Musa from BRAC. Central questions posed to the panelists related to the ways in which climate risks and corresponding actions can be evaluated and how both the international system and local communities can ensure the effective implementation of adaptation strategies. In his opening statement, Christoph Gornott emphasised the importance of linking climate risk evaluation on the one hand with adaptation action on the other hand. He also highlighted the role of science which should guide adaptation efforts, especially given the speed at which the climate is changing but also its long-term future dimension. In these efforts, an interdisciplinary and integrated approach is important to link different methods, such as cost-benefit analyses with qualitative methods, and different sectors for a more comprehensive picture. Finally, Christoph Gornott addressed the issue of local ownership and knowledge which is key to effective adaptation planning.

For more information on the Climate Dialogues, please click here.

Presentation by Christoph Gornott

Validation workshop of the climate risk analysis on district level in Ghana

75 local stakeholders from the Upper West Region met in Wa under precautionary measures against COVID-19 to validate the findings of the PIK’s “Climate risk analysis for identifying and weighing adaptation strategies on district level in Ghana” conducted for the Deutsche Gesellschaft für Internationale Zusammenarbeit (GIZ) GmbH on behalf of the German Federal Ministry of Economic Cooperation and Development (BMZ). The workshop was hosted by the University for Development Studies (UDS) in Wa and the REACH project. The PIK team and GIZ joined the workshop digitally in order to present key insights and recommendations from the study and to engage with the participants in a lively discussion on the study outcomes. The local stakeholders identified in an extensive group work wider entry points for the results in various political processes and projects and thereby demonstrated the usefulness of the study results for further uptake in the Upper West Region and beyond. The insights from the workshop will feed into the final study that will be published soon. Stay tuned for the final publication!

Group work at the validation workshop

Farmradio International reports on climate risk analysis for Ethiopia

The NGO Farmradio International and its Ethiopian branch developed a radio script which informs farmers about the climate risks and adaptation strategies identified and evaluated in the climate risk analysis. This script is written in accessible language and enables radio stations across Ethiopia and beyond to broadcast information on the study results to their many listeners. In Ethiopia, Farmradio’s programs reach up to 32 million people. The script is available in English, Amharic, Tigrinya and Oromo via this link.

Mali: Human health

Climate change threatens the health and sanitation sector through more frequent incidences of heatwaves, floods, droughts and storms. Among the key health challenges in Mali are morbidity and mortality through vector-borne diseases, such as malaria, waterborne diseases related to extreme weather events (e.g. flooding), such as diarrhoea, respiratory diseases, malnutrition, HIV / AIDS, meningitis, injury and mortality through extreme weather events [31]. Climate change can impact food and water supply, which can increase the risk of malnutrition, hunger and death by famine. Scientific investigations found a link between extreme weather events and mortality patterns in Mali: Precipitation events of more than 10 mm per day were negatively associated with survival of children under five years of age, while colder temperatures were associated with lower mortality rates among the general population [32], [33].

Furthermore, climate change is likely to lengthen transmission periods and alter the geographic range of diseases, such as malaria or meningitis. Malaria continues to be the primary cause of morbidity and mortality in Mali, particularly among children under the age of 5 [34]. In some regions, malaria risk will likely increase, for instance, due to higher occurrence of flooding, but overall risk is projected to fall due to rising temperatures [35], [36]. Temperature increases could also lead to more frequent outbreaks of meningitis [37]. Mali is part of the so-called Meningitis Belt, which largely coincides with the Sahel region and which is where the majority of meningitis epidemics occur. Access to health care in Mali remains limited and is being further complicated by armed conflict: According to Médecins Sans Frontières (MSF), many public and humanitarian health organisations have limited or even closed down their operations due to armed conflicts [38].

Exposure to heatwaves

Figure 17: Projections of population exposure to heatwaves at least once a year for Mali for different GHG emissions scenarios.

Rising temperatures will result in more frequent heatwaves in Mali, leading to increased heat-related mortality. Under RCP6.0, the population affected by at least one heatwave per year is projected to increase from 2 % in 2000 to 16 % in 2080 (Figure 17).

Heat-related mortality

Figure 18: Projections of heat-related mortality for Mali for different GHG emissions scenarios assuming no adaptation to increased heat.

Furthermore, under RCP6.0, heat-related mortality will likely increase from 2.5 to about 12 deaths per 100 000 people per year, which equals a factor of more than five towards the end of the century compared to year 2000 levels, provided that no adaptation to hotter conditions will take place (Figure 18). Under RCP2.6, heat-related mortality is projected to increase to about 6 deaths per 100 000 people per year in 2080.

References

[31] Centers for Disease Control and Prevention, “CDC in Mali,” Atlanta, Georgia, 2018.
[32] P. Han and J. Foltz, “The Impacts of Climate Shocks on Child Mortality in Mali,” Madison, WI, 2013.
[33] B. Bakshi, R. J. Nawrotzki, J. R. Donato, and L. S. Lelis, “Exploring the Link Between Climate Variability and Mortality in Sub-Saharan Africa,” Int. J. Environ. Sustain. Dev., vol. 18, no. 2, pp. 206–237, 2019.
[34] U.S. President’s Malaria Initiative, “Mali Country Profile,” Washington, D.C., 2017.
[35] R. Boyce, R. Reyes, M. Matte, M. Ntaro, E. Mulogo, J. P. Metlay, L. Band, and M. J. Siedner, “Severe Flooding and Malaria Transmission in the Western Ugandan Highlands: Implications for Disease Control in an Era of Global Climate Change,” J. Infect. Dis., vol. 214, pp. 1403–1410, 2016.
[36] C. Caminade, A. E. Jones, R. Ross, and G. Macdonald, “Malaria in a Warmer West Africa,” Nat. Clim. Chang., vol. 6, no. November, pp. 984–985, 2016.
[37] A. M. Molesworth, L. E. Cuevas, S. J. Connor, A. P. Morse, and M. C. Thomson, “Environmental Risk and Meningitis Epidemics in Africa,” Emerg. Infect. Dis., vol. 9, no. 10, pp. 1287–1293, 2003.
[38] Médecins Sans Frontières, “Violence in Central Mali Has Reached Unprecedented Levels,” 2019. Online available: https://www.msf.org/mali-conflict-curfew-and-floods-put-healthcare-out-reach [Accessed: 24-Feb-2020].

Mali: Ecosystems

Climate change is expected to have a significant influence on the ecology and distribution of tropical ecosystems, though the magnitude, rate and direction of these changes are uncertain [28]. With rising temperatures and increased frequency and intensity of droughts, wetlands and riverine systems are increasingly at risk of being converted to other ecosystems, with plants being succeeded and animals losing habitats. Increased temperatures and droughts can also impact succession in forest systems while concurrently increasing the risk of invasive species, all of which affect ecosystems.

Species richness

Figure 15: Projections of the aggregate number of amphibian, bird and mammal species for Mali for different GHG emissions scenarios.

Model projections of species richness (including amphibians, birds and mammals) and tree cover for Mali are shown in Figure 15 and 16, respectively. Under RCP6.0, species richness is projected to decrease by 10 % in the southern half of Mali by 2080 compared to the year 2000. In the centre, however, species richness is projected to increase by up to 30 % (Figure 15). All models agree on this trend.

Tree cover

Figure 16: Tree cover projections for Mali for different GHG emissions scenarios.

In terms of tree cover, model agreement is lower: Models project increases in tree cover of up to 1.5 % in parts of southern Mali under RCP6.0 (Figure 16). Projections of both species richness and tree cover under RCP2.6 are subject to high modelling uncertainty.

Although these results suggest a positive picture for climate change impacts on tree cover, it is important to keep in mind that the model projections exclude any impacts on biodiversity loss from human activities such as land use, which have been responsible for significant losses of global biodiversity in the past, and are expected to remain its main driver in the future [29]. For example, rapid growth of agricultural production and logging have resulted in high rates of deforestation: Mali has lost 330 000 ha of forest cover in the period from 2001 to 2018, which is equivalent to a 13 % decrease since 2000 [30]. Given Mali’s rapid population growth, this trend is likely to continue and will impact animal and plant biodiversity.

References

[28] T. M. Shanahan, K. A. Hughen, N. P. McKay, J. T. Overpeck, C. A. Scholz, W. D. Gosling, D. William, C. S. Miller, J. A. Peck, J. W. King, and C. W. Heil, “CO2 and Fire Influence Tropical Ecosystem Stability in Response to Climate Change,” Nat. Publ. Gr., no. July, pp. 1–8, 2016.
[29] IPBES, “Report of the Plenary of the Intergovernmental Science-Policy Platform on Biodiversity and Ecosystem Services on the Work of Its Seventh Session,” n.p., 2019.
[30] Global Forest Watch, “Mali.” Online available: https://www.globalforestwatch.org [Accessed: 25-Feb-2020].