Kenya: Water resources
Climate model projections for East Africa, including Kenya, have been predicting a wetter future under climate change. Yet, recent experience shows an opposite trend with droughts occurring every three to four years and a major drought every ten years [15]. This discrepancy between model projections and experience on the ground has been termed the East African climate paradox [19]. Though different hypotheses exist, the scientific community has not yet been able to provide a reliable and comprehensive explanation for this paradox. Climate variability and the steady degradation of water resources are likely to make water availability even less predictable and limit capacities. Even areas which were known to receive high precipitation amounts and to be abundant in freshwater, such as the Mount Kenya region, experience more dry spells with rivers falling dry in an increasing frequency [20]. These changes are driven, amongst other factors, by high rates of water extraction for irrigation, livestock and domestic use, leading to conflicts between upstream and downstream water users. Lack of water availability has further been responsible for power shortages from decreased hydropower, which provides over 65 % of Kenya’s electricity, resulting in production and income losses in various sectors [15].
Per capita water availability
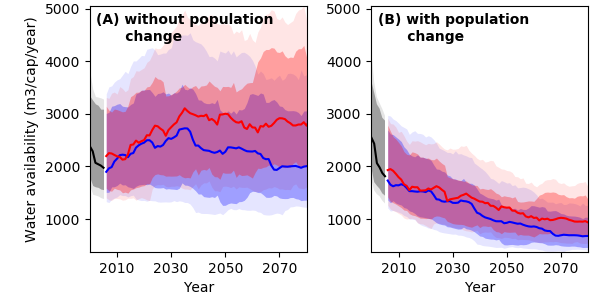
Current projections of water availability in Kenya display high uncertainty under both GHG emissions scenarios. Assuming a constant population level, multi-model median projections suggest an increase of water availability under RCP6.0 and no change under RCP2.6 (Figure 9A). Yet, when accounting for population growth according to SSP2 projections4, per capita water availability for Kenya is projected to decline by 73 % under RCP2.6 and by 63 % under RCP6.0 by 2080 relative to the year 2000 (Figure 9B). While this decline is primarily driven by population growth rather than climate change, it highlights the urgency to invest in water saving measures and technologies for future water consumption.
Spatial distribution of water availability
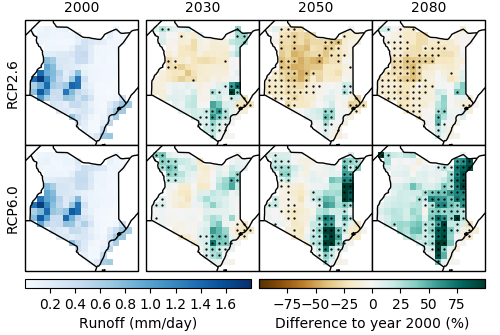
Projections of future water availability from precipitation vary depending on the region and scenario (Figure 10). Under RCP2.6, water availability will decrease by up to 25 % in western Kenya and increase by up to 25 % in southern Kenya by 2080. Most models agree on this trend. The picture is different for RCP6.0: Model agreement shifts to eastern Kenya, where water availability will increase by up to 80 %.
4 Shared Socio-economic Pathways (SSPs) outline a narrative of potential global futures, including estimates of broad characteristics such as country level population, GDP or rate of urbanisation. Five different SSPs outline future realities according to a combination of high and low future socio-economic challenges for mitigation and adaptation. SSP2 represents the “middle of the road”-pathway.
References
[15] World Bank, “Climate Variability and Water Resources in Kenya,” Washington, D.C., 2009.
[19] D. Rowell, B. Booth, S. Nicholson, and B. Good, “Reconciling Past and Future Rainfall Trends over East Africa,” J. Clim., vol. 28, no. 24, pp. 9768–9788, 2015.
[20] B. Notter, L. MacMillan, D. Viviroli, R. Weingartner, and H. P. Liniger, “Impacts of Environmental Change on Water Resources in the Mt. Kenya Region,” J. Hydrol., vol. 343, no. 3–4, pp. 266–278, 2007.