Chad: Agriculture
Smallholder farmers in Chad are increasingly challenged by the uncertainty and variability of weather that climate change causes [17], [18]. Since crops are predominantly rainfed, they depend on water availability from precipitation. However, the length and intensity of the rainy season is becoming increasingly unpredictable and the use of irrigation facilities remains limited due to high costs of initial investment, inefficient use of water resources and a lack of water storage and delivery techniques [27]. In 2002, less than 8 % of the estimated irrigation potential of 335 000 ha (0.7 % of the total national crop land) was irrigated [6]. Especially in central and northern Chad, soils are poor in nutrients, sandy and shallow, which has a negative effect on water retention, making soils vulnerable to drying and erosion [28].
Crop land exposure to drought
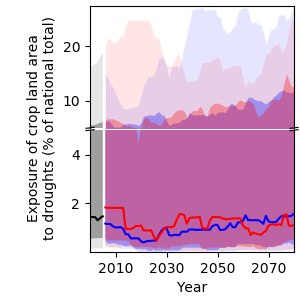
Currently, the high uncertainty of projections regarding water availability (Figure 9) translates into high uncertainty of drought projections (Figure 10). According to the median over all models employed for this analysis, the national crop land area exposed to at least one drought per year will hardly change in response to global warming. However, there are models that project a strong increase in drought exposure. Under RCP6.0, the likely range of drought exposure of the national crop land area per year widens from 0.6–5.5 % in 2000 to 0.5–12.7 % in 2080. The very likely range widens from 0.1–15.8 % in 2000 to 0.1–25.0 % in 2080. This means that some models project up to a twofold increase in drought exposure over this time period, while others project no change.
Crop yield projections
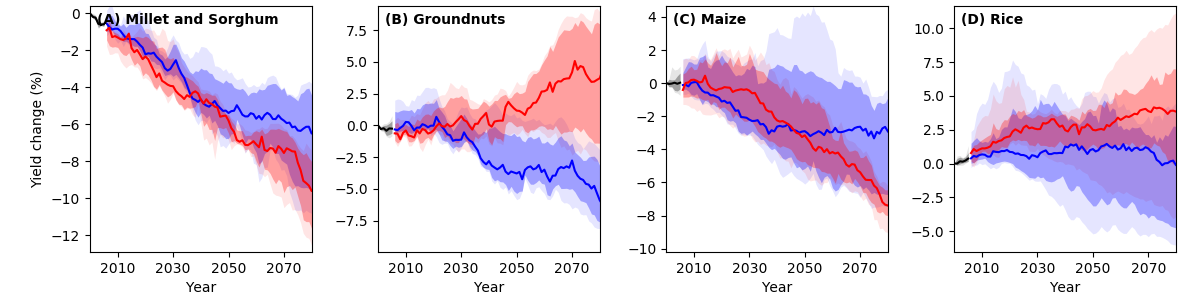
Climate change will have a negative impact on yields of maize, millet and sorghum (Figure 11)6. While maize is sensitive to hot temperatures above 35 °C, millet and sorghum have higher tolerance for hot temperatures and dry periods [29]. Still, model results indicate a negative yield trend for all three crops under both RCPs with a stronger decrease under RCP6.0. Compared to the year 2000, amounts are projected to decline by 7.4 % for maize and 9.6 % for millet and sorghum by 2080 under RCP6.0. Under RCP2.6, yields of maize are projected to decline by 2.9 % and yields of millet and sorghum by 6.5 %. Yields of rice, on the contrary, are projected to gain from climate change. Under RCP6.0, projections show an increase by 3.8 % by 2080 relative to the year 2000. These positive results under RCP6.0 can be mainly explained by the CO2 fertilisation effect, which benefits plant growth. Rice is a so-called C3 plant, which follows a different metabolic pathway than maize, millet and sorghum (C4 plants), and benefits more from higher concentration pathways. Yields of groundnuts are projected to decrease under RCP2.6 and increase under RCP6.0. The decrease under RCP2.6 can be explained by non-temperature related parameters such as changes in precipitation, while the increase under RCP6.0 can be explained by the CO2 fertilisation effect.
Overall, adaptation strategies such as switching to improved varieties in climate change sensitive crops should be considered, yet carefully weighed against adverse outcomes, such as a resulting decline of agro-biodiversity and loss of local crop types.
6 Modelling data is available for a selected number of crops only. Hence, the crops listed on page 2 may differ. Maize, millet and sorghum are modelled for all countries, except for Madagascar.
References
[6] AQUASTAT, “Irrigation and Drainage Development,” 2002. Online available: http://www.fao.org/nr/water/aquastat/data/query/resultshtml. [Accessed: 17-Apr-2020].
[17] B. Sarr et al., “Adapting to Climate Variability and Change in Smallholder Farming Communities: A Case Study From Burkina Faso, Chad and Niger (CVCADAPT),” J. Agric. Ext. Rural Dev., vol. 7, no. 1, pp. 16–27, 2015.
[18] P. Maharana, A. Y. Abdel-Lathif, and K. C. Pattnayak, “Observed Climate Variability Over Chad Using Multiple Observational and Reanalysis Datasets,” Glob. Planet. Change, vol. 162, pp. 252–265, 2018.
[27] FAO and Lake Chad Basin Commission, “Adaptive Water Management in the Lake Chad Basin,” Rome, Italy and N’Djamena, Chad, 2009.
[28] A. Jones et al., Soil Atlas of Africa. Luxembourg, Luxembourg: European Commission, Publications Office of the European Commission, 2013.