Uganda: Human health

Climate change threatens the health and sanitation sector through more frequent incidences of heatwaves, floods, droughts and storms. Among the key health challenges in Uganda are morbidity and mortality through HIV / AIDS, vector-borne diseases such as malaria, respiratory diseases, tuberculosis and waterborne diseases related to extreme weather events (e.g. flooding), such as diarrhoea and mortality, which can increase the risk of malnutrition, hunger and death by famine [30]. Scientific investigations among smallholder farmers in Uganda found a strong link between drought, food security and stunting [31]. Stunting rates differ among regions: In Tooro in western Uganda, 41 % of children under the age of five are stunted, while in Teso in eastern Uganda, the stunting rate is at 14 % [32]. Furthermore, climate change is likely to lengthen transmission periods and alter the geographic range of vector-borne diseases, for instance, due to changes in precipitation and rising temperatures. Increases in precipitation in addition to more frequent and extreme flooding could increase the risk of malaria [33]. Temperature increases could allow for transmission in areas which were previously free of malaria, such as the highlands [34]. However, when exceeding 33 °C, transmission may also decrease [35]. In Uganda, malaria is the most frequently reported disease at both public and private health facilities with 12.4 million cases and 13 203 deaths in 2018, according to WHO estimates [36].

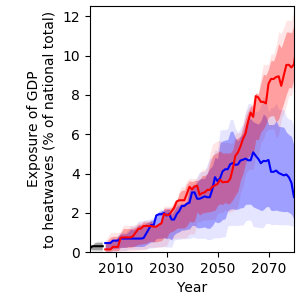
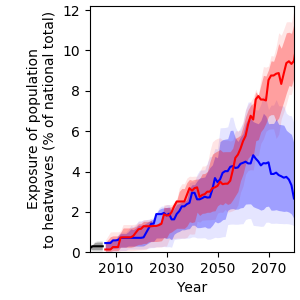
Exposure to heatwaves

Rising temperatures will result in more frequent heatwaves in Uganda, leading to increased heat-related mortality. Under RCP6.0, the population affected by at least one heatwave per year is projected to increase from 0.2 % in 2000 to 9.5 % in 2080 (Figure 17).

Figure 17: Projections of population exposure to heatwaves at least once a year for Uganda for different GHG emissions scenarios.

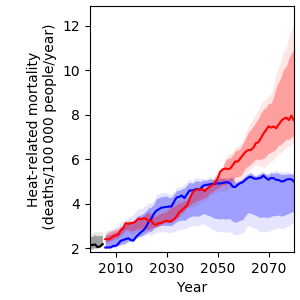
Heat-related mortality

Furthermore, under RCP6.0, heat-related mortality will likely increase from approximately 2 to about 8 deaths per 100 000 people per year, which translates to an increase by a factor of four towards the end of the century compared to year 2000 levels, provided that no adaptation to hotter conditions will take place. Under RCP2.6, heat-related mortality is projected to increase to about 5 deaths per 100 000 people per year in 2080 (Figure 18).

Figure 18: Projections of heatrelated mortality for Uganda for different GHG emissions scenarios assuming no adaptation to increased heat.

References

[30] Centers for Disease Control and Prevention (CDC), “CDC in Uganda,” Atlanta, Georgia, 2019.
[31] S. Ly, P. O. Okello, R. Mpiira, and Z. Ali, “Climate Event Consequences on Food Insecurity and Child Stunting Among Smallholder Farmers in Uganda: A Cross-Sectional Study,” Lancet Glob. Heal., 2018.
[32] USAID, “Uganda: Nutrition Profile,” Washington, D.C., 2018.
[33] R. Boyce, R. Reyes, M. Matte, M. Ntaro, E. Mulogo, J. P. Metlay, L. Band, and M. J. Siedner, “Severe Flooding and Malaria Transmission in the Western Ugandan Highlands: Implications for Disease Control in an Era of Global Climate Change,” J. Infect. Dis., vol. 214, pp. 1403–1410, 2016.
[34] D. Alonso, M. J. Bouma, and M. Pascual, “Epidemic Malaria and Warmer Temperatures in Recent Decades in an East African Highland,” Proc. R. Soc. B, vol. 278, pp. 1661–1669, 2011.
[35] P. E. Parham and E. Michael, “Modeling the Effects of Weather and Climate Change on Malaria Transmission,” Environ. Health Perspect., vol. 118, pp. 620–626, 2010.
[36] WHO, “World Malaria Report 2019,” Rome, Italy, 2019.

Uganda: Ecosystems

Climate change is expected to have a significant influence on the ecology and distribution of tropical ecosystems, though the magnitude, rate and direction of these changes are uncertain [27]. With rising temperatures and increased frequency and intensity of droughts, wetlands and riverine systems are increasingly at risk of being converted to other ecosystems with plants being succeeded and animals losing habitats. Increased temperatures and droughts can also impact succession in forest systems while concurrently increasing the risk of invasive species, all of which affect ecosystems.

Species richness

Figure 15: Projections of the aggregate number of amphibian, bird and mammal species for Uganda for different GHG emissions scenarios.

Model projections of species richness (including amphibians, birds and mammals) and tree cover for Uganda are shown in Figure 15 and 16, respectively. Changes depend on the region and scenario: Under RCP2.6, species richness is projected to increase by 15 % in central Uganda and decrease by 10 % in the south-west and north-east of the country, while under RCP6.0, projections indicate an increase by 20 % in south-eastern Uganda and a decrease by 10 % in the west and north-east of the country, with higher modelling uncertainty (Figure 15).

Tree cover

Figure 16: Tree cover projections for Uganda for different GHG emissions scenarios.

Tree cover projections for Uganda are also characterised by high modelling uncertainty. Models tend to project a slight increase of up to 5 % under RCP6.0, especially in eastern Uganda, and a slight decrease of up to 4 % under RCP2.6, which can be observed in various small patches across the country (Figure 16).

It is important to keep in mind that the model projections exclude any impacts on biodiversity loss from human activities such as intensive land use and land use change, which have been responsible for significant losses of global biodiversity in the past, and are expected to remain its main driver in the future [28]. In Uganda, the need for new settlements and land for cultivation threaten tree cover and biodiversity with high rates of deforestation: Uganda has lost 844 000 ha of forest cover in the period from 2001 to 2019, which is equivalent to an 11 % decrease since 2000 [29].

References

[27] T. M. Shanahan, K. A. Hughen, N. P. McKay, J. T. Overpeck, C. A. Scholz, W. D. Gosling, C. S. Miller, J. A. Peck, J. W. King, and C. W. Heil, “CO2 and Fire Influence Tropical Ecosystem Stability in Response to Climate Change,” Nat. Publ. Gr., no. July, pp. 1–8, 2016.
[28] IPBES, “Report of the Plenary of the Intergovernmental Science-Policy Platform on Biodiversity and Ecosystem Services on the Work of Its Seventh Session,” n.p., 2019.
[29] Global Forest Watch, “Uganda,” 2018. Online available: https://www.globalforestwatch.org [Accessed: 03-Mar-2020].

Uganda: Infrastructure

Climate change is expected to significantly affect Uganda’s infrastructure sector through extreme weather events, such as flooding and droughts. High precipitation amounts can lead to flooding of transport infrastructure including roads, railroads and airports, while high temperatures can cause roads, bridges and protective structures to develop cracks and degrade more quickly. Transport infrastructure is essential for social, economic and agricultural livelihoods: Roads serve communities to trade their goods and access healthcare, education, credit as well as other services, especially in rural and remote areas. Uganda’s transport sector is dominated by road transport accounting for 90 % of passenger and freight traffic [23]. Compared to other low-income countries in Africa, road density in Uganda is high at 365 km / 1 000 km². However, especially district roads which connect to rural areas are in poor condition, limiting accessibility of rural areas, especially during the rainy season [23]. Investments will have to be made into building climate-resilient road networks.

Extreme weather events will also have devastating effects on human settlements and economic production sites, especially in urban areas with high population densities like Kampala or Gulu. Informal settlements are particularly vulnerable to extreme weather events: Makeshift homes are often built in unstable geographical locations including river banks, where flooding can lead to loss of housing, contamination of water, injury or death. Dwellers usually have low adaptive capacity to respond to such events due to high levels of poverty and a lack of riskreducing infrastructures. For example, heavy rains in December 2019 caused flooding and landslides in different regions across Uganda, particularly affecting communities in the east of the country [24]. At least 38 people have died and a total of 300 000 people were affected [24]. Flooding and droughts will also affect hydropower generation: Uganda draws 77 % of its energy from hydropower with a total installed capacity of 914 MW in 2017 [25]. However, variability in precipitation and climatic conditions could severely disrupt hydropower generation.

The risk of infrastructure damage in Uganda is likely to increase. However, projections of river flood events are subject to substantial modelling uncertainty, largely due to the uncertainty of future projections of precipitation amounts and their spatial distribution, affecting flood occurrence (see also Figure 4). For Uganda, projections of major roads exposed to river floods are characterised by high modelling uncertainty with median projections showing a decrease of 5 % under RCP2.6 and an increase of 9 % under RCP6.0 by 2080 compared to 7 % in the year 2000 (Figure 12). Exposure of urban land area to river floods is projected to hardly change under RCP2.6 and to increase from 0.3 to 0.9 % under RCP6.0 (Figure 13).

Figure 12: Projections of major roads exposed to river floods at least once a year for Uganda for different GHG emissions scenarios.
Figure 13: Projections of urban land area exposed to river floods at least once a year for Uganda for different GHG emissions scenarios.

With the exposure of the GDP to heatwaves projected to increase from 0.2 % in 2000 to 2.8 % (RCP2.6) and 9.6 % (RCP6.0) by the end of the century (Figure 14), it is recommended that policy planners start identifying heat-sensitive production sites and activities, and integrating climate adaptation strategies such as improved solar-powered cooling systems, “cool roof” isolation materials or switching of hours of operation from day to night [26].

Figure 14: Exposure of GDP in Uganda to heatwaves for different GHG emissions scenarios.

References

[23] R. Ranganathan and V. Foster, “Uganda’s Infrastructure: A Continental Perspective,” Washington, D.C., 2012.
[24] OCHA, “Uganda: Floods and Landslides,” New York, 2019.
[25] Electric Regulatory Authority, “Annual Report FY 2016–17,” Kampala, Uganda.
[26] M. Dabaieh, O. Wanas, M. A. Hegazy, and E. Johansson, “Reducing Cooling Demands in a Hot Dry Climate: A Simulation Study for Non-Insulated Passive Cool Roof Thermal Performance in Residential Buildings,” Energy Build., vol. 89, pp. 142–152, 2015.

Uganda: Agriculture

Smallholder farmers in Uganda are increasingly challenged by the uncertainty and variability of weather that climate change causes [19], [20]. Since crops are predominantly rainfed, they depend on water availability from precipitation and are prone to drought. However, the length and intensity of the rainy season is becoming increasingly unpredictable and the use of irrigation facilities remains limited due to high operation costs, limited extension services and problems regarding irrigation management [21]. Currently, only 0.5 % of the national crop land suitable for irrigation (3.03 million hectares) is irrigated [7]. The main irrigated crop is rice, followed by sugar cane, maize and vegetables [21].

Crop land exposure to drought

Figure 10: Projections of crop land area exposed to drought at least once a year for Uganda for different GHG emissions scenarios.

Currently, the high uncertainty of projections regarding water availability (Figure 9) translates into high uncertainty of drought projections (Figure 10). According to the median over all models employed for this analysis, the national crop land area exposed to at least one drought per year will hardly change in response to global warming. However, there are models that project a strong increase in drought exposure. Under RCP2.6, the likely range of drought exposure of the national crop land area per year widens from 0–0.4 % in 2000 to 0–1.7 % in 2080. The very likely range widens from 0–2.3 % in 2000 to 0–17.1 % in 2080. This means that some models project up to a tenfold increase in drought exposure over this time period, while others project no change.

Crop yield projections

Figure 11: Projections of crop yield changes for major staple crops in Uganda for different GHG emissions scenarios assuming constant land use and agricultural management.

Climate change will have a negative impact on yields of maize, millet and sorghum (Figure 11)5. While maize is sensitive to hot temperatures above 35 °C, millet and sorghum tolerate hot temperatures and dry periods better [22]. Still, model results indicate a negative yield trend for all three crops under both RCPs. Compared to the year 2000, amounts are projected to decline by 6 % for maize and 13 % for millet and sorghum by 2080 under either RCP. Yield projections for groundnuts and cassava vary depending on the scenario. Under RCP2.6, yields are projected to decline by 7 % for groundnuts and 12 % for cassava. Under RCP6.0, groundnut yields are projected to gain from climate change with an increase of 4 %, while cassava yields are projected to decline by 2 % by 2080 relative to the year 2000. The decrease under RCP2.6 can be explained by non-temperature related parameters such as changes in precipitation, while the RCP6.0 results can be explained by the CO2 fertilisation effect under higher concentration pathways. Groundnuts and cassava are so-called C3 plants, which follow a different metabolic pathway than maize, millet and sorghum (C4 plants), and benefit more from higher CO2 concentration.

Overall, adaptation strategies such as switching to improved varieties in climate change sensitive crops should be considered, yet carefully weighed against adverse outcomes, such as a resulting decline of agro-biodiversity and loss of local crop types.

5 Modelling data is available for a selected number of crops only. Hence, the crops listed on page 2 may differ. Maize, millet and sorghum are modelled for all countries.

References

[7] Ministry of Agriculture Animal Industry and Fisheries and Ministry of Water and Environment, “National Irrigation Policy: Agricultural Transformation Through Irrigation Development,” Entebbe, Uganda, 2017.
[19] F. M. Mwaura and G. Okoboi, “Climate Variability and Crop Production in Uganda,” J. Sustain. Dev., vol. 7, no. 2, pp. 159–172, 2014.
[20] V. Sridharan, E. P. Ramos, E. Zepeda, B. Boehlert, A. Shivakumar, C. Taliotis, and M. Howells, “The Impact of Climate Change on Crop Production in Uganda: An Integrated Systems Assessment With Water and Energy Implications,” Water, vol. 11, pp. 1–24, 2019.
[21] J. Wanyama, H. Ssegane, I. Kisekka, A. J. Komakech, N. Banadda, A. Zziwa, T. O. Ebong, C. Mutumba, N. Kiggundu, R. K. Kayizi, D. B. Mucunguzi, and F. L. Kiyimba, “Irrigation Development in Uganda: Constraints, Lessons Learned and Future Perspectives,” J. Irrig. Drain. Eng., vol. 143, no. 5, pp. 1–10, 2017.

Uganda: Water resources

Uganda is known for abundant surface water resources including lakes, rivers and wetlands. 15 % of the country’s total land surface is covered by open water and 13 % by wetlands [13]. However, climate change is likely to impact Uganda’s water resources through variability in precipitation, rising temperatures and drought [14]. Over the last decades, Uganda has experienced an increase in the frequency and intensity of drought, particularly in the Karamoja region in the north-east, impacting agricultural production and food security [15]. Drought also materialises in decreasing water levels in Lake Victoria, which receives 80 % of its fresh water from direct rainfall [16]. In the period from 2004 to 2005, water levels in Lake Victoria dropped by 1.1 m to 10.69 m, reaching the lowest level since 1951 [17]. This drop was attributed to drought, in addition to unsustainable dam operations [17]. Water levels recovered afterwards, reaching a reversed record of 13.42 m in May 2020 [18]. This rise was attributed to continued rainfall, which started in late 2019 and resulted in the displacement of more than 480 000 people across the region [18]. Overall, however, water demand is going to increase due to population growth, putting pressure on Uganda’s water resources [13]. Another main driver behind the draining and degradation of wetlands is agricultural expansion, in addition to growing livestock populations, mining activities and deforestation [13].

Per capita water availability

Figure 8: Projections of water availability from precipitation per capita and year with (A) national population held constant at year 2000 level and (B) changing population in line with SSP2 projections for different GHG emissions scenarios, relative to the year 2000.

Current projections of water availability in Uganda display high uncertainty under both GHG emissions scenarios. Assuming a constant population level, multi-model median projections suggest no change in per capita water availability over Uganda by the end of the century under RCP2.6 and an increase of 18 % under RCP6.0 (Figure 8A). Yet, when accounting for population growth according to SSP2 projections4, per capita water availability for Uganda is projected to decline by 80 % by 2080 relative to the year 2000 under both scenarios (Figure 8B). Even though this decline is primarily driven by population growth rather than climate change, it highlights the urgency to invest in water saving measures and technologies for future water consumption as well as protection of watersheds and reservoirs.

Spatial distribution of water availability

Figure 9: Water availability from precipitation (runoff) projections for Uganda for different GHG emissions scenarios.

Projections of future water availability from precipitation vary depending on the region and scenario (Figure 9). Under RCP2.6, models project a decrease of up to 25 % in southern and eastern Uganda, while under RCP6.0, model agreement is low all over Uganda. This modelling uncertainty, along with the high natural variability of precipitation, contributes to uncertain future precipitation trends all over Uganda.

4 Shared Socio-economic Pathways (SSPs) outline a narrative of potential global futures, including estimates of broad characteristics such as country level population, GDP or rate of urbanisation. Five different SSPs outline future realities according to a combination of high and low future socio-economic challenges for mitigation and adaptation. SSP2 represents the “middle of the road”-pathway.

References

[13] A. I. Rugumayo, E. Jennings, S. Linnane, and B. Misstear, “Water Resources in Uganda,” in Water is Life, G. Honor Fagan, S. Linnane, K. G. McGuigan, and A. I. Rugumayo, Eds. Rugby, United Kingdom: Practical Action Publishing, 2015, pp. 73–96.
[14] USAID, “Climate Vulnerability Profile: Uganda,” Washington, D.C., 2012.
[15] C. Nakalembe, “Characterizing Agricultural Drought in the Karamoja Subregion of Uganda With Meteorological and Satellite-Based Indices,” Nat. Hazards, vol. 91, pp. 837–862, 2018.
[16] J. L. Awange, L. Ogalo, K. H. Bae, P. Were, P. Omondi, P. Omute, and M. Omullo, “Falling Lake Victoria Water Levels: Is Climate a Contributing Factor?,” Clim. Change, vol. 89, pp. 281–297, 2008.
[17] D. Kull, “Connections Between Recent Water Level Drops in Lake Victoria, Dam Operations and Drought,” Nairobi, Kenya, 2006.
[18] FEWS NET, “Seasonal Monitor: More Floods Affect Lake and Riverine Areas as End of the March to May Rainy Season Approaches,” 2020. Online available: https://fews.net/east-africa/seasonal-monitor/may-2020-0 [Accessed: 23-Jun-2020].

Uganda: Climate

Temperature

Figure 2: Air temperature projections for Uganda for different GHG emissions scenarios.

In response to increasing greenhouse gas (GHG) concentrations, air temperature over Uganda is projected to rise by 1.5 to 3.5 °C (very likely range) by 2080 relative to the year 1876, depending on the future GHG emissions scenario (Figure 2). Compared to pre-industrial levels, median climate model temperature increases over Uganda amount to approximately 1.4 °C in 2030, 1.7 °C in 2050 and 1.8 °C in 2080 under the low emissions scenario RCP2.6. Under the medium / high emissions scenario RCP6.0, median climate model temperature increases amount to 1.3 °C in 2030, 1.5 °C in 2050 and 2.3 °C in 2080.

Very hot days

Figure 3: Projections of the annual number of very hot days (daily maximum temperature above 35 °C) for Uganda for different GHG emissions scenarios.

In line with rising mean annual temperatures, the annual number of very hot days (days with daily maximum temperature above 35 °C) is projected to rise substantially and with high certainty over most parts of Uganda (Figure 3). Under the medium / high emissions scenario RCP6.0, the multi-model median, averaged over the whole country, projects 13 more very hot days per year in 2030 than in 2000, 26 more in 2050 and 39 more in 2080. In some parts, especially in northern Uganda, this amounts to about 150 days per year by 2080.

Precipitation

Figure 4: Annual mean precipitation projections for Uganda for different GHG emissions scenarios, relative to the year 2000.

Future projections of precipitation are less certain than projections of temperature change due to high natural year-to-year variability (Figure 4). Out of the three climate models underlying this analysis, two models project an increase and one model projects no change under RCP6.0, while under RCP2.6, two models project no change and one model projects a decrease in mean annual precipitation over Uganda. Median model projections show no change under RCP2.6 and an increase of 67 mm under RCP6.0 until 2080.

Heavy precipitation events

Figure 5: Projections of the number of days with heavy precipitation over Uganda for different GHG emissions scenarios, relative to the year 2000.

In response to global warming, heavy precipitation events are expected to become more intense in many parts of the world due to the increased water vapour holding capacity of a warmer atmosphere. At the same time, the number of days with heavy precipitation events is expected to increase. This tendency can also be found in climate projections for Uganda. Under RCP6.0, median climate model projections show an increase in the number of days with heavy precipitation from 8 in the year 2000 to 10 in the year 2080. Under RCP2.6, the number of days with heavy precipitation is projected to not change (Figure 5).

Soil moisture

Figure 6: Soil moisture projections for Uganda for different GHG emissions scenarios, relative to the year 2000.

Soil moisture is an important indicator for drought conditions. In addition to soil parameters and management, it depends on both precipitation and evapotranspiration and therefore also on temperature, as higher temperatures translate to higher potential evapotranspiration. Annual mean top 1-m soil moisture projections for Uganda hardly show any change under both RCPs by 2080 compared to the year 2000 (Figure 6). However, there is considerable modelling uncertainty as different hydrological models project different directions of change, which makes it difficult to identify a clear trend.

Potential evapotranspiration

Figure 7: Potential evapotranspiration projections for Uganda for different GHG emissions scenarios, relative to the year 2000.

Potential evapotranspiration is the amount of water that would be evaporated and transpired if sufficient water was available at and below the land surface. Since warmer air can hold more water vapour, it is expected that global warming will increase potential evapotranspiration in most regions of the world. In line with this expectation, hydrological projections for Uganda indicate a stronger and more continuous rise of potential evapotranspiration under RCP6.0 than under RCP2.6 (Figure 7). Under RCP6.0, potential evapotranspiration is projected to increase by 1.6 % in 2030, 2.2 % in 2050 and 4.9 % in 2080 compared to year 2000 levels.

3 Changes are expressed relative to year 1876 temperature levels using the multi-model median temperature change from 1876 to 2000 as a proxy for the observed historical warming over that time period.