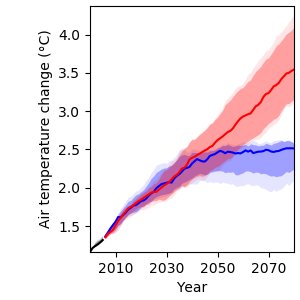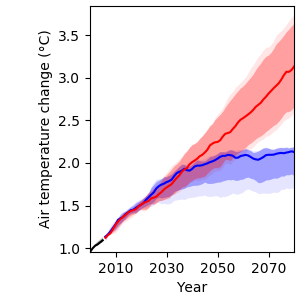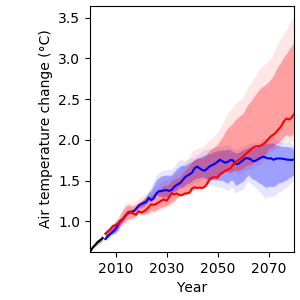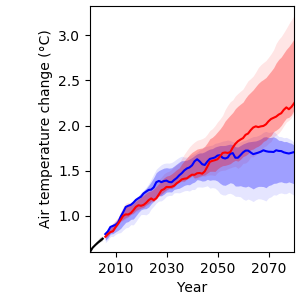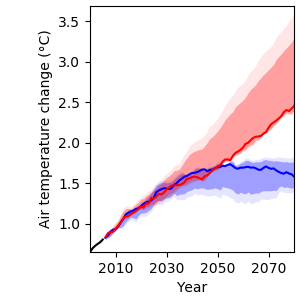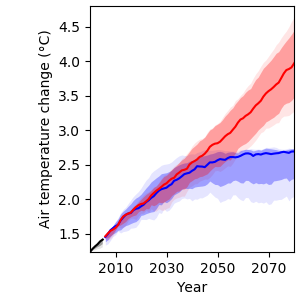
Temperature
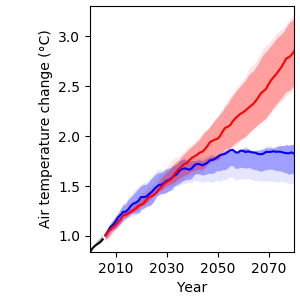
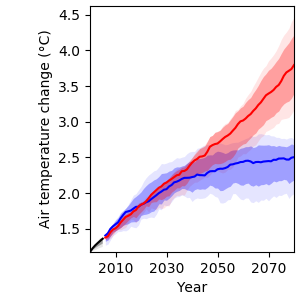
In response to increasing greenhouse gas (GHG) concentrations, air temperature over Madagascar is projected to rise by 1.5 to 3.2 °C (very likely range) by 2080 relative to the year 1876, depending on the future GHG emissions scenario (Figure 2). Compared to pre-industrial levels, median climate model temperature increases over Madagascar amount to approximately 1.6 °C in 2030 and 1.8 °C in both 2050 and 2080 under the low emissions scenario RCP2.6. Under the medium / high emissions scenario RCP6.0, median climate model temperature increases amount to 1.5 °C in 2030, 2.0 °C in 2050 and 2.8 °C in 2080.
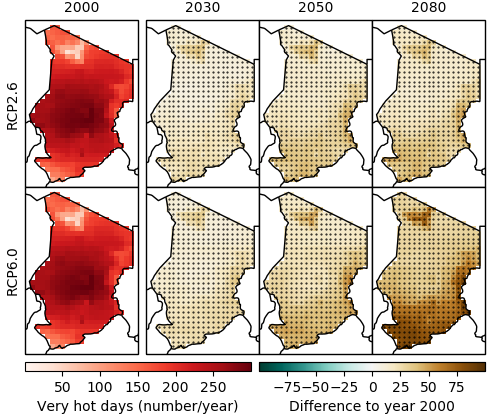
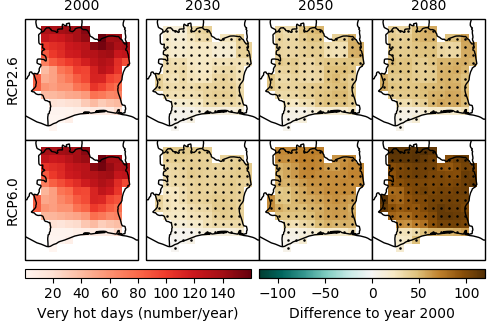
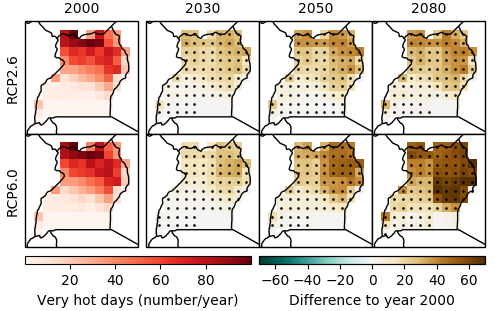
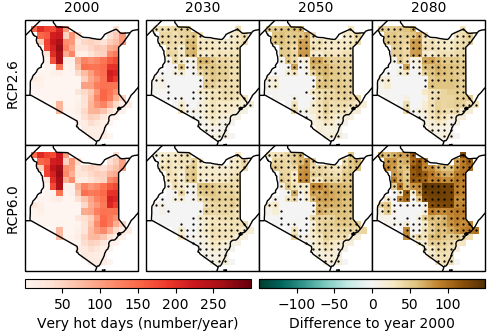
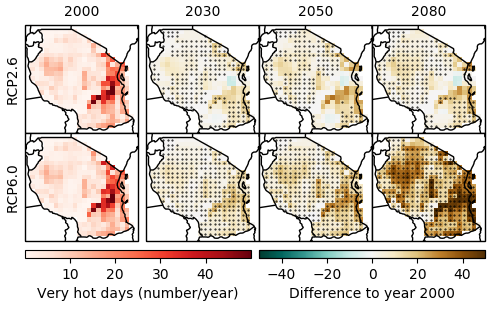
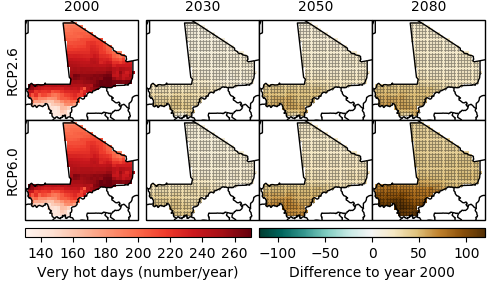
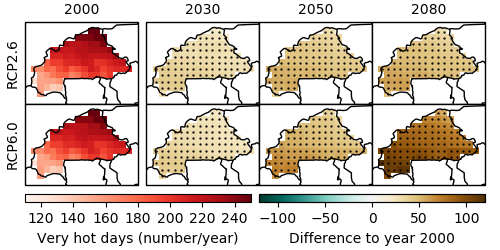
Very hot days
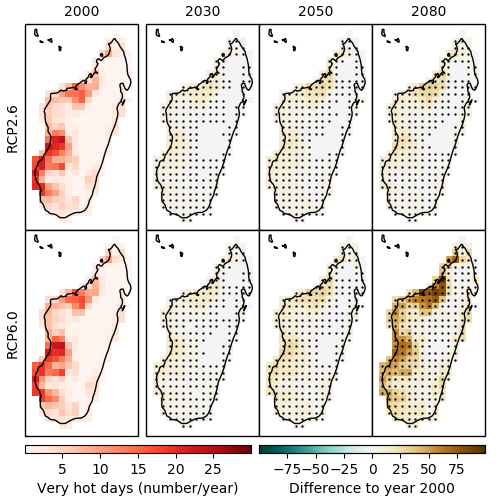
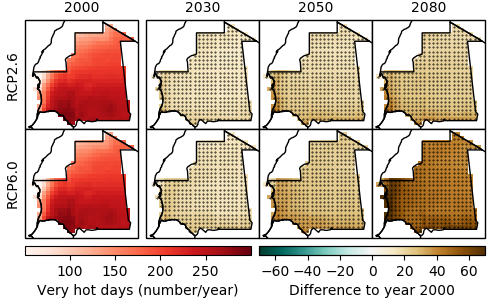
In line with rising mean annual temperatures, the annual number of very hot days (days with daily maximum temperature above 35 °C) is projected to rise substantially and with high certainty, in particular over western Madagascar (Figure 3). Under the medium / high emissions scenario RCP6.0, the multi-model median, averaged over the whole country, projects 5 more very hot days per year in 2030 than in 2000, 8 more in 2050 and 24 more in 2080. In some parts, especially on the western coast of Madagascar, this amounts to about 90 days per year by 2080.
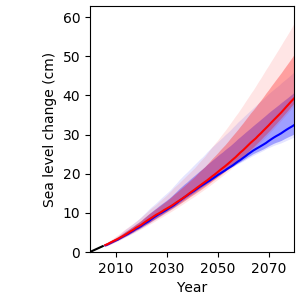
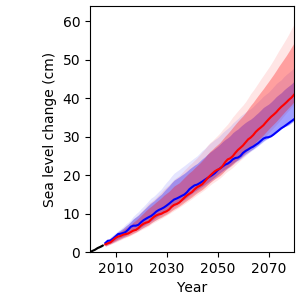
Sea level rise
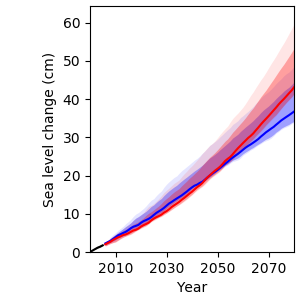
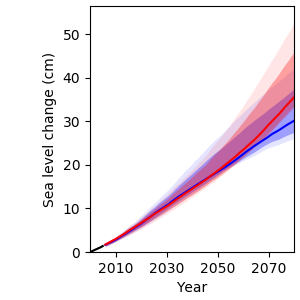
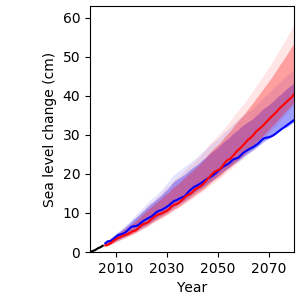
In response to globally increasing temperatures, the sea level off the coast of Madagascar is projected to rise (Figure 4). Until 2050, very similar sea levels are projected under both emissions scenarios. Under RCP6.0 and compared to year 2000 levels, the median climate model projects a sea level rise by 11 cm in 2030, 22 cm in 2050, and 43 cm in 2080. This threatens Madagascar’s coastal communities and may cause saline intrusion in coastal waterways and groundwater reservoirs.
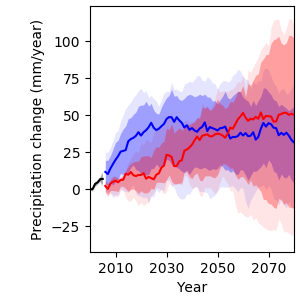
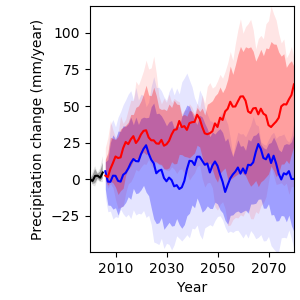
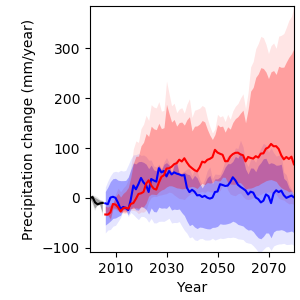
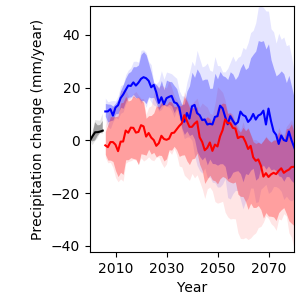
Precipitation
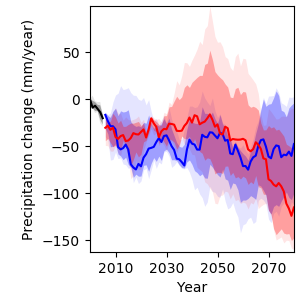
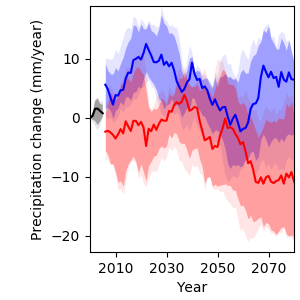
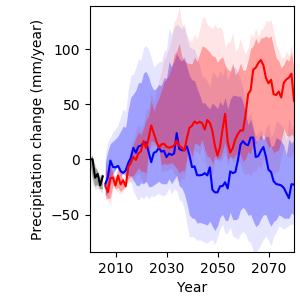
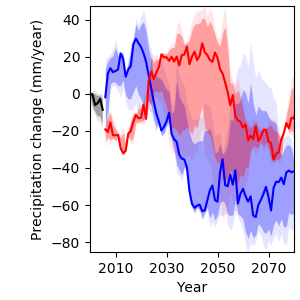
Future projections of precipitation are less certain than projections of temperature change due to high natural year-to-year variability (Figure 5). Out of the four climate models underlying this analysis, two models project a decrease in mean annual precipitation over Madagascar and two models project little change. Median model projections show a precipitation decrease of 114 mm per year by 2080 under RCP6.0, while median model projections for RCP2.6 show a decrease at the beginning of the century, which settles at a decrease of 47 mm by 2080 compared to year 2000. Higher greenhouse gas emissions suggest an overall drier future for Madagascar.
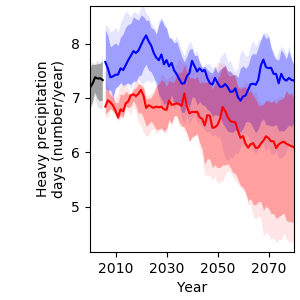
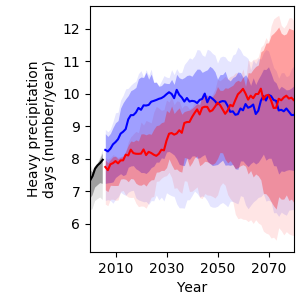
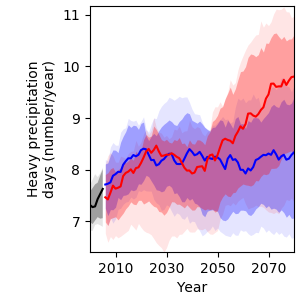
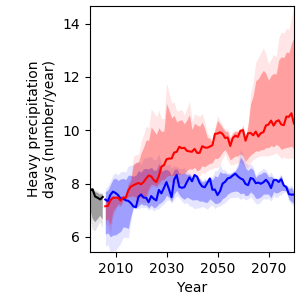
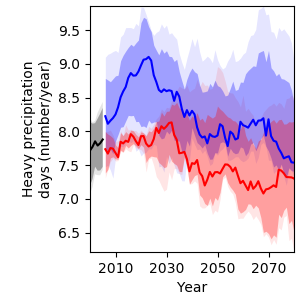
Heavy precipitation events
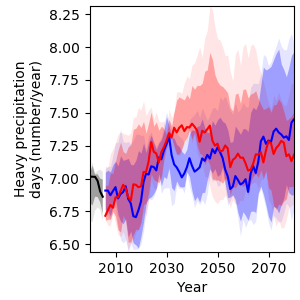
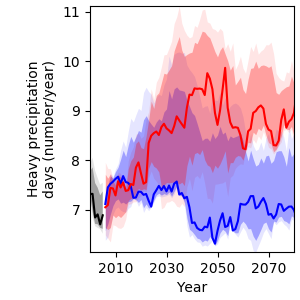
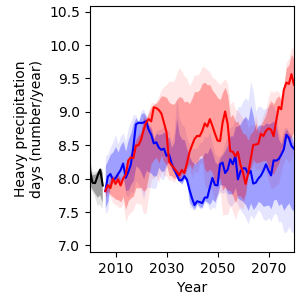
In response to global warming, heavy precipitation events are expected to become more intense in many parts of the world due to the increased water vapour holding capacity of a warmer atmosphere. At the same time, the number of days with heavy precipitation events is expected to increase. This tendency is also reflected in climate projections for Madagascar (Figure 6), with climate models projecting a slight increase in the number of days with heavy precipitation events, from 7.0 days per year in 2000 to 7.5 and 7.2 days per year in 2080 under RCP2.6 and RCP6.0, respectively.
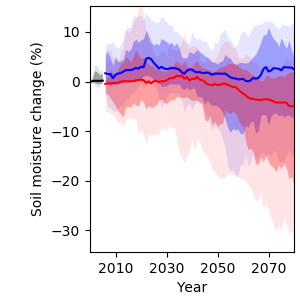
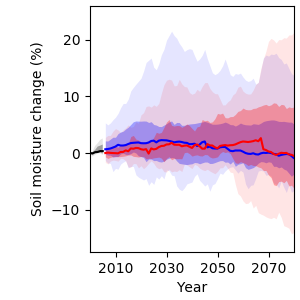
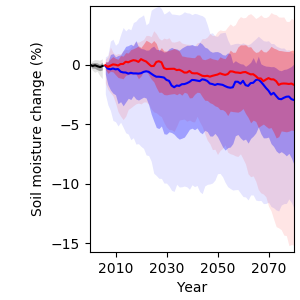
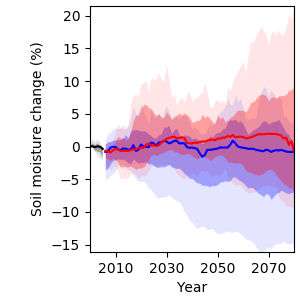
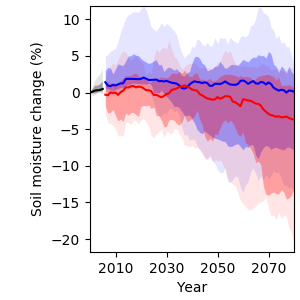
Soil moisture
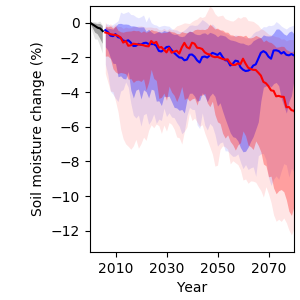
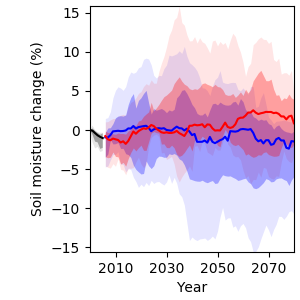
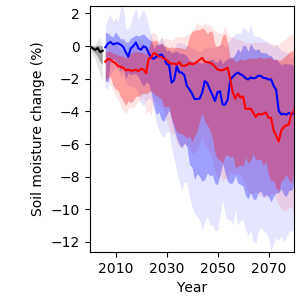
Soil moisture is an important indicator for drought conditions. In addition to soil parameters and management, it depends on both precipitation and temperature, as higher temperatures translate to higher potential evapotranspiration. Projections for annual mean soil moisture values for the topsoil (from the surface to a depth of 1 metre) show a slight decrease under RCP2.6 and a stronger decrease of 5 % under RCP6.0 by 2080 compared to the year 2000 (Figure 7). However, looking at the different models underlying this analysis, there is large year-to-year variability and modelling uncertainty, with some models projecting a much stronger decrease in soil moisture.
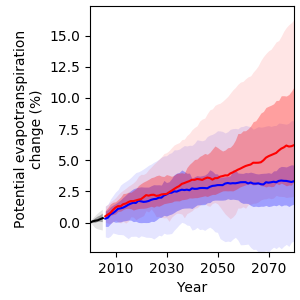
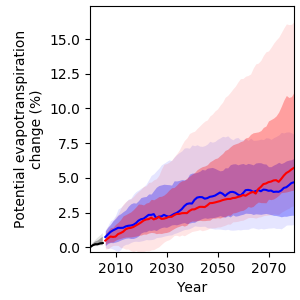
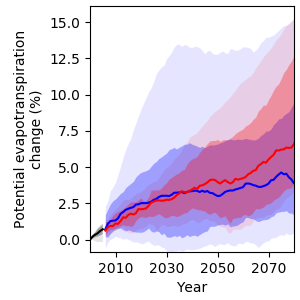
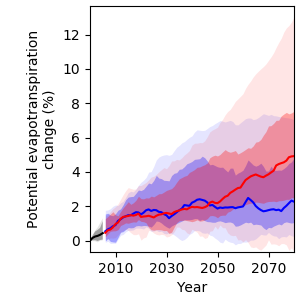
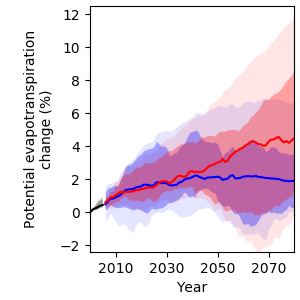
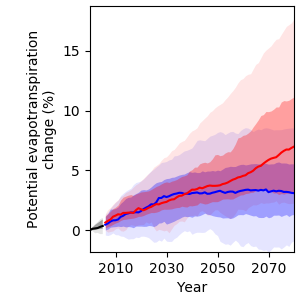
Potential evapotranspiration
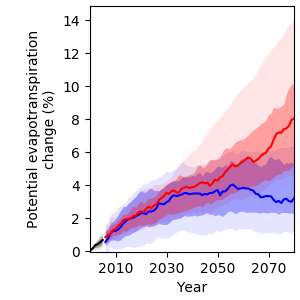
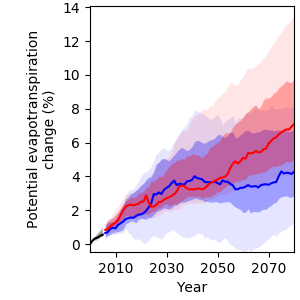
Potential evapotranspiration is the amount of water that would be evaporated and transpired if sufficient water was available at and below land surface. Since warmer air can hold more water vapour, it is expected that global warming will increase potential evapotranspiration in most regions of the world. In line with this expectation, hydrological projections for Madagascar indicate a stronger rise of potential evapotranspiration under RCP6.0 than under RCP2.6 (Figure 8). Under RCP6.0, potential evapotranspiration is projected to increase by 3 % in 2030, 4 % in 2050 and 8 % in 2080 compared to year 2000 levels.
4 Changes are expressed relative to year 1876 temperature levels using the multi-model median temperature change from 1876 to 2000 as a proxy for the observed historical warming over that time period.