Chad: Human health

Climate change threatens the health and sanitation sector through more frequent incidences of heatwaves, floods, droughts and storms. Among the key health challenges in Chad are morbidity and mortality through vector-borne diseases such as malaria, waterborne diseases related to extreme weather events (e.g. flooding) such as diarrhoea and cholera, respiratory diseases, measles and meningitis [38], [39]. Climate change can impact food and water supply, which can increase the risk of malnutrition and hunger. Many of these challenges are expected to become more severe under climate change. According to the World Health Organization (WHO), more than 2.5 million cases of malaria including 8 693 deaths were reported in 2018 [38]. Climate change is likely to have an impact on malaria transmission periods and the geographic range of vector-borne diseases: In Chad, like in other Sahel countries, the general malaria risk could decrease due to rising temperatures, but some regions are likely to become more vulnerable, for instance, due to more frequent incidences of flooding [39], [40]. Temperature increases and humidity decreases due to climate change have the potential to significantly increase the number of meningitis cases and prepone the seasonal onset of meningitis [41], [42]. Southern Chad is part of the so-called Meningitis Belt, which largely coincides with the Sahel region and which is where the majority of meningitis epidemics occur. Food insecurity and malnutrition present another major health problem: Between June and August 2020, 1.1 million people are expected to be severely food insecure with more than 460 000 cases of severe acute malnutrition [43].

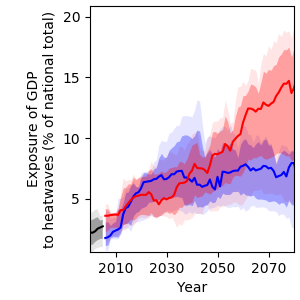
Exposure to heatwaves

Figure 17: Projections of population exposure to heatwaves at least once a year for Chad for different GHG emissions scenarios.

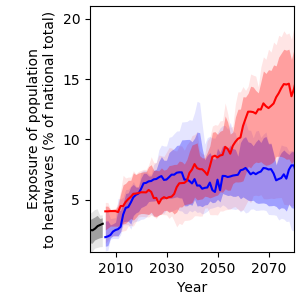
Rising temperatures will result in more frequent heatwaves in Chad, leading to increased heat-related mortality. Under RCP6.0, the population affected by at least one heatwave per year is projected to increase from 2.5 % in 2000 to 14 % in 2080 (Figure 17).

Heat-related mortality

Figure 18: Projections of heat-related mortality for Chad for different GHG emissions scenarios assuming no adaptation to increased heat.

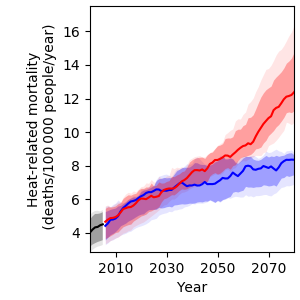
Furthermore, under RCP6.0, heat-related mortality will likely increase from approximately 4 to about 12 deaths per 100 000 people per year (Figure 18). This translates to an increase by a factor of more than three towards the end of the century compared to year 2000 levels, provided that no adaptation to hotter conditions will take place. Under RCP2.6, heat-related mortality is projected to increase to about 8 deaths per 100 000 people per year in 2080.

References

[38] WHO, “World Malaria Report 2019,” Rome, Italy, 2019.
[39] R. Boyce et al., “Severe Flooding and Malaria Transmission in the Western Ugandan Highlands: Implications for Disease Control in an Era of Global Climate Change,” J. Infect. Dis., vol. 214, pp. 1403–1410, 2016.
[40] C. Caminade, A. E. Jones, R. Ross, and G. Macdonald, “Malaria in a Warmer West Africa,” Nat. Clim. Chang., vol. 6, no. November, pp. 984–985, 2016.
[41] A. F. Abdussalam et al., “The Impact of Climate Change on Meningitis in Northwest Nigeria: An Assessment Using CMIP5 Climate Model Simulations,” Weather. Clim. Soc., vol. 6, no. 3, pp. 371–379, 2014.
[42] A. M. Molesworth, L. E. Cuevas, S. J. Connor, A. P. Morse, and M. C. Thomson, “Environmental Risk and Meningitis Epidemics in Africa,” Emerg. Infect. Dis., vol. 9, no. 10, pp. 1287–1293, 2003.
[43] OCHA, “Chad: Humanitarian Situation Overview (February 2020),” N’Djamena, Chad, 2020.

Chad: Ecosystems

Climate change is expected to have a significant influence on the ecology and distribution of tropical ecosystems, though the magnitude, rate and direction of these changes are uncertain [34]. With rising temperatures and increased frequency and intensity of droughts, wetlands and riverine systems are increasingly at risk of being converted to other ecosystems with plants being succeeded and animals losing habitats. Increased temperatures and droughts can also influence succession in forest systems while concurrently increasing the risk of invasive species, all of which affect ecosystems.

Species richness

Figure 15: Projections of the aggregate number of amphibian, bird and mammal species for Chad for different GHG emissions scenarios.

Model projections of species richness (including amphibians, birds and mammals) and tree cover for Chad are shown in Figure 15 and 16, respectively. The models applied for this analysis show similar patterns of change in species richness across both RCPs, with higher modelling uncertainty under RCP2.6. Under RCP6.0, models project increases in the number of species of up to 40 % for north-eastern Chad and decreases of up to 20 % for the western and southern parts of the country by 2080.

Tree cover

Figure 16: Tree cover projections for Chad for different GHG emissions scenarios.

With regards to tree cover, model projections vary depending on the scenario (Figure 16). Under RCP2.6, models project a decrease in tree cover of 2 % for the very south of Chad, while under RCP6.0, tree cover is projected to increase by 2 % in the south of the country by 20807.

Although these results paint a rather positive picture for climate change impacts on tree cover, it is important to keep in mind that the model projections exclude any impacts on biodiversity loss from human activities such as land use, which have been responsible for significant losses of global biodiversity in the past, and are expected to remain its main driver in the future [35]. For example, population influxes in affected areas, need for pasture and agricultural land and logging have resulted in high rates of deforestation [36]: Chad has lost 1.54 million ha of forest cover in the period from 2001 to 2016, which is equivalent to a 25 % decrease [37].

7 Due to the low starting values of tree cover in most parts of Chad, even small actual changes can lead to high percentage changes, which is why tree cover projections should be considered with caution.

References

[34] T. M. Shanahan et al., “CO² and Fire Influence Tropical Ecosystem Stability in Response to Climate Change,” Nat. Publ. Gr., no. July, pp. 1–8, 2016.
[35] IPBES, “Report of the Plenary of the Intergovernmental Science-Policy Platform on Biodiversity and Ecosystem Services on the Work of Its Seventh Session,” n.p., 2019.
[36] FAO and UNHCR, “Rapid Woodfuel Assessment 2017 Baseline for the Area Around the City of Goré, Chad,” Rome, Italy and Geneva, Switzerland, 2018.
[37] Global Forest Watch, “Chad.” Online available: https://www.globalforestwatch.org [Accessed: 27-Apr-2020].

Chad: Infrastructure

Climate change is expected to significantly affect Chad’s infrastructure sector through extreme weather events, such as flooding and heatwaves. High precipitation amounts can lead to flooding of roads, while high temperatures can cause roads, bridges and protective structures to develop cracks and degrade more quickly. The absence of railways, seasonal navigability of rivers and limited airport facilities increase Chad’s reliance on road transportation [30]. The country’s road density ranges from 40.5 km per 1 000 km2 in the south to only 6.4 km per 1 000 km2 in the north, making it one of the lowest on the continent [30]. Many unpaved roads become impassable during the rainy season, cutting off villages and rural communities [30]. Investments will have to be made to build climate-resilient road networks.

Extreme weather events will also have devastating effects on human settlements and economic production sites, especially in urban areas with high population densities like N’Djamena, Moundou or Sarh. Informal settlements are particularly vulnerable to extreme weather events: Makeshift homes are often built in unstable geographical locations including river banks, where flooding can lead to loss of housing, contamination of water, injury or death. Dwellers usually have low adaptive capacity to respond to such events due to high levels of poverty and a lack of risk-reducing infrastructures. In 2012, heavy floods in southern Chad affected up to 700 000 people [31], with the most affected regions being Tandjilé, Mayo-Kebbi Est, Mayo-Kebbi Ouest and Sila [32]. At least 255 000 hectares of cropland and 96 000 houses were destroyed [32].

Despite the risk of infrastructure damage being likely to increase, precise predictions of the location and the extent of exposure are difficult to make. For example, projections of river flood events are subject to substantial modelling uncertainty, largely due to the uncertainty of future projections of precipitation amounts and their spatial distribution, affecting flood occurrence (see also Figure 4). In the case of Chad, projections show an increase in the exposure of major roads to river floods from 1.4 % in 2000 to 2.2 % by 2080 under RCP6.0. Under RCP2.6, projections indicate an increase towards mid-century but no overall change by 2080 (Figure 12). Exposure of urban land area to floods is projected to not change under RCP2.6 and to increase slightly under RCP6.0, from 0.2 % in 2000 to 0.4 % in 2080 (Figure 13).

Figure 12: Projections of major roads exposed to river floods at least once a year for Chad for different GHG emissions scenarios.
Figure 13: Projections of urban land area exposed to river floods at least once a year for Chad for different GHG emissions scenarios.

While three out of four models project an increase in the exposure of the GDP to heatwaves, its magnitude is uncertain, with one model projecting strong and two models projecting more moderate increases. Median model projections for RCP2.6 show an increase from 2.2 % in 2000 to 8.0 % by 2080. Under RCP6.0, exposure is projected to rise to 14 % over the same period (Figure 14). It is recommended that policy planners start identifying heat-sensitive economic production sites and activities, and integrating climate adaptation strategies, such as improved, solar-powered cooling systems, “cool roof” isolation materials or switching the operating hours from day to night [33].

Figure 14: Exposure of GDP in Chad to heatwaves for different GHG emissions scenarios.

References

[30] Logistics Cluster and WFP, “Chad Logistics Infrastructure,” 2020. Online available: https://dlca.logcluster.org/display/public/DLCA/2+Chad+Logistics+Infrastructure [Accessed: 27-Apr-2020].
[31] OCHA, “Humanitarian Bulletin: Chad (January 2013),” N’Djamena, Chad, 2013.
[32] OCHA, “Chad: Humanitarian Snapshot (24 September 2012),” N’Djamena, Chad, 2012.
[33] M. Dabaieh, O. Wanas, M. A. Hegazy, and E. Johansson, “Reducing Cooling Demands in a Hot Dry Climate: A Simulation Study for Non-Insulated Passive Cool Roof Thermal Performance in Residential Buildings,” Energy Build., vol. 89, pp. 142–152, 2015.

Chad: Agriculture

Smallholder farmers in Chad are increasingly challenged by the uncertainty and variability of weather that climate change causes [17], [18]. Since crops are predominantly rainfed, they depend on water availability from precipitation. However, the length and intensity of the rainy season is becoming increasingly unpredictable and the use of irrigation facilities remains limited due to high costs of initial investment, inefficient use of water resources and a lack of water storage and delivery techniques [27]. In 2002, less than 8 % of the estimated irrigation potential of 335 000 ha (0.7 % of the total national crop land) was irrigated [6]. Especially in central and northern Chad, soils are poor in nutrients, sandy and shallow, which has a negative effect on water retention, making soils vulnerable to drying and erosion [28].

Crop land exposure to drought

Figure 10: Projections of crop land area exposed to drought at least once a year for Chad for different GHG emissions scenarios.

Currently, the high uncertainty of projections regarding water availability (Figure 9) translates into high uncertainty of drought projections (Figure 10). According to the median over all models employed for this analysis, the national crop land area exposed to at least one drought per year will hardly change in response to global warming. However, there are models that project a strong increase in drought exposure. Under RCP6.0, the likely range of drought exposure of the national crop land area per year widens from 0.6–5.5 % in 2000 to 0.5–12.7 % in 2080. The very likely range widens from 0.1–15.8 % in 2000 to 0.1–25.0 % in 2080. This means that some models project up to a twofold increase in drought exposure over this time period, while others project no change.

Crop yield projections

Figure 11: Projections of crop yield changes for major staple crops in Chad for different GHG emissions scenarios assuming constant land use and agricultural management.

Climate change will have a negative impact on yields of maize, millet and sorghum (Figure 11)6. While maize is sensitive to hot temperatures above 35 °C, millet and sorghum have higher tolerance for hot temperatures and dry periods [29]. Still, model results indicate a negative yield trend for all three crops under both RCPs with a stronger decrease under RCP6.0. Compared to the year 2000, amounts are projected to decline by 7.4 % for maize and 9.6 % for millet and sorghum by 2080 under RCP6.0. Under RCP2.6, yields of maize are projected to decline by 2.9 % and yields of millet and sorghum by 6.5 %. Yields of rice, on the contrary, are projected to gain from climate change. Under RCP6.0, projections show an increase by 3.8 % by 2080 relative to the year 2000. These positive results under RCP6.0 can be mainly explained by the CO2 fertilisation effect, which benefits plant growth. Rice is a so-called C3 plant, which follows a different metabolic pathway than maize, millet and sorghum (C4 plants), and benefits more from higher concentration pathways. Yields of groundnuts are projected to decrease under RCP2.6 and increase under RCP6.0. The decrease under RCP2.6 can be explained by non-temperature related parameters such as changes in precipitation, while the increase under RCP6.0 can be explained by the CO2 fertilisation effect.

Overall, adaptation strategies such as switching to improved varieties in climate change sensitive crops should be considered, yet carefully weighed against adverse outcomes, such as a resulting decline of agro-biodiversity and loss of local crop types.

6 Modelling data is available for a selected number of crops only. Hence, the crops listed on page 2 may differ. Maize, millet and sorghum are modelled for all countries, except for Madagascar.

References

[6] AQUASTAT, “Irrigation and Drainage Development,” 2002. Online available: http://www.fao.org/nr/water/aquastat/data/query/resultshtml. [Accessed: 17-Apr-2020].
[17] B. Sarr et al., “Adapting to Climate Variability and Change in Smallholder Farming Communities: A Case Study From Burkina Faso, Chad and Niger (CVCADAPT),” J. Agric. Ext. Rural Dev., vol. 7, no. 1, pp. 16–27, 2015.
[18] P. Maharana, A. Y. Abdel-Lathif, and K. C. Pattnayak, “Observed Climate Variability Over Chad Using Multiple Observational and Reanalysis Datasets,” Glob. Planet. Change, vol. 162, pp. 252–265, 2018.
[27] FAO and Lake Chad Basin Commission, “Adaptive Water Management in the Lake Chad Basin,” Rome, Italy and N’Djamena, Chad, 2009.
[28] A. Jones et al., Soil Atlas of Africa. Luxembourg, Luxembourg: European Commission, Publications Office of the European Commission, 2013.

Chad: Water resources

Over the last decades, Chad has experienced strong seasonal and annual variations in precipitation, which present a major constraint to agricultural production [17], [18]. The country was hit by severe droughts between 1950 and the mid-1980s as precipitation decreased during that time [19]. Annual precipitation sums recovered afterwards but remain below the 20th century average [19]. Further droughts were registered in 2005, 2008, 2010 and 2012 [20]. The 2012 Sahel drought affected a total of 3.6 million people in Chad [21]. Transhumance used to be an effective way to deal with variations in precipitation and droughts, with many Chadian pastoralists migrating to the Central African Republic during the dry season [22]. However, people’s reliance on this type of pastoralism has been challenged by increasingly unpredictable precipitation patterns and a 150-km southward spread of the Sahara and Sahel zones over the period between 2005 and 2015 [23]. The resulting lack of pastures and water has led to increasing competition over these scarce resources [23]. Other stressors include population growth, conflicts between farmers and herders and terrorist activities in the greater region, making this mode of living less profitable and sometimes even dangerous [24], [25]. Repeated droughts tend to have a cascading effect: Lack of water reduces crop yields, which increases the risk of food insecurity for people and their livestock, which in turn limits their capacity to cope with future droughts [26].

Per capita water availability

Figure 8: Projections of water availability from precipitation per capita and year with (A) national population held constant at year 2000 level and (B) changing population in line with SSP2 projections for different GHG emissions scenarios, relative to the year 2000.

Current projections of water availability in Chad display high uncertainty under both GHG emissions scenarios. Assuming a constant population level, multi-model median projections suggest almost no change in per capita water availability over Chad by the end of the century under either RCPs (Figure 8A). Yet, when accounting for population growth according to SSP2 projections5, per capita water availability for Chad is projected to decline by 75 % by 2080 relative to the year 2000 under both scenarios (Figure 8B). While this decline is primarily driven by population growth rather than climate change, it highlights the urgency to invest in water saving measures and technologies for future water consumption.

Spatial distribution of water availability

Figure 9: Water availability from precipitation (runoff) projections for Chad for different GHG emissions scenarios.

Projections of future water availability from precipitation vary depending on the region (Figure 9). In line with precipitation projections, water availability is projected to increase in central and particularly in northern Chad under both RCPs. However, especially towards the end of the century, model agreement on these increases is low. The projected increase in water availability is based on a constant population level. Hence, water saving measures are likely to remain important for the country’s rapidly growing population.

5 Shared Socio-economic Pathways (SSPs) outline a narrative of potential global futures, including estimations of broad characteristics such as country-level population, GDP or rate of urbanisation. Five different SSPs outline future realities according to a combination of high and low future socio-economic challenges for mitigation and adaptation. SSP2 represents the “middle of the road”-pathway.

References

[17] B. Sarr et al., “Adapting to Climate Variability and Change in Smallholder Farming Communities: A Case Study From Burkina Faso, Chad and Niger (CVCADAPT),” J. Agric. Ext. Rural Dev., vol. 7, no. 1, pp. 16–27, 2015.
[18] P. Maharana, A. Y. Abdel-Lathif, and K. C. Pattnayak, “Observed Climate Variability Over Chad Using Multiple Observational and Reanalysis Datasets,” Glob. Planet. Change, vol. 162, pp. 252–265, 2018.
[19] USAID, “A Climate Trend Analysis of Chad,” Washington, D.C., 2012.
[20] USAID, “Climate Change Risk Profile: West Africa Sahel,” Washington, D.C., 2017.
[21] FAO, “Race on to Help Farmers and Herders in Drought-Stricken Sahel,” 2012. Online available: http://www.fao.org/emergencies/fao-inaction/stories/stories-detail/en/c/148046 [Accessed: 24-Apr-2020].
[22] FAO, “Strengthening Social Cohesion Among Communities in the Central African Republic and Chad Through Sustainable Management of Cross-Border Transhumance,” 2020. Online available: http://www.fao.org/emergencies/fao-in-action/stories/stories-detail/en/c/1261074 [Accessed: 23-Apr-2020].
[23] Republic of Chad, “Intended Nationally Determined Contributions (INDC) for the Republic of Chad,” N’Djamena, Chad, 2015.
[24] U. T. Okpara, L. C. Stringer, and A. J. Dougill, “Using a Novel Climate–Water Conflict Vulnerability Index to Capture Double Exposures in Lake Chad,” Reg. Environ. Chang., vol. 17, pp. 351–366, 2017.
[25] S. T. Asah, “Transboundary Hydro-Politics and Climate Change Rhetoric: An Emerging Hydro-Security Complex in the Lake Chad Basin,” WIREs Water, vol. 2, pp. 37–45, 2015.
[26] S. Traore and T. Owiyo, “Dirty Droughts Causing Loss and Damage in Northern Burkina Faso,” Int. J. Glob. Warm., vol. 5, no. 4, pp. 498–513, 2013.

Chad: Climate

Temperature

Figure 2: Air temperature projections for Chad for different GHG emissions scenarios.4

In response to increasing greenhouse gas (GHG) concentrations, air temperature over Chad is projected to rise by 2.1 to 4.3 °C (very likely range) by 2080 relative to the year 1876, depending on the future GHG emissions scenario (Figure 2). Compared to pre-industrial levels, median climate model temperature increases over Chad amount to approximately 2.1 °C in 2030 and 2.5 °C in both 2050 and 2080 under the low emissions scenario RCP2.6. Under the medium / high emissions scenario RCP6.0, median climate model temperature increases amount to 2.1 °C in 2030, 2.6 °C in 2050 and 3.5 °C in 2080.

Very hot days

Figure 3: Projections of the annual number of very hot days (daily maximum temperature above 35 °C) for Chad for different GHG emissions scenarios.

In line with rising mean annual temperatures, the annual number of very hot days (days with daily maximum temperature above 35 °C) is projected to rise with high certainty all over Chad (Figure 3). Under the medium / high emissions scenario RCP6.0, the multi-model median, averaged over the whole country, projects 17 more very hot days per year in 2030 than in 2000, 31 more in 2050 and 49 more in 2080. In some parts, especially in central Chad, this amounts to more than 300 days per year by 2080.

Precipitation

Figure 4: Annual mean precipitation projections for Chad for different GHG emissions scenarios, relative to the year 2000.

Future projections of precipitation are less certain than projections of temperature change due to high natural year-to-year variability (Figure 4). Out of the four climate models underlying this analysis, one model projects a decreasing trend in mean annual precipitation over Chad, one projects no change and two models project strong increases under RCP6.0. Compared to year 2000, median model projections show an increase in mean annual precipitation by 32 mm under RCP2.6 and 50 mm under RCP6.0 until 2080.

Heavy precipitation events

Figure 5: Projections of the number of days with heavy precipitation over Chad for different GHG emissions scenarios, relative to the year 2000.

In response to global warming, heavy precipitation events are expected to become more intense in many parts of the world due to the increased water vapour holding capacity of a warmer atmosphere. At the same time, the number of days with heavy precipitation events is expected to increase. This tendency is also found in climate projections for Chad (Figure 5), with climate models projecting an increase in the number of days with heavy precipitation, from 7 days per year in 2000 to 9 and 10 days per year in 2080 under RCP2.6 and RCP6.0, respectively.

Soil moisture

Figure 6: Soil moisture projections for Chad for different GHG emissions scenarios, relative to the year 2000.

Soil moisture is an important indicator for drought conditions. In addition to soil parameters and management, it depends on both precipitation and evapotranspiration and therefore also on temperature, as higher temperatures translate to higher potential evapotranspiration. Annual mean top 1-m soil moisture projections for Chad show almost no change under either RCP by 2080 compared to the year 2000 (Figure 6). However, there is considerable modelling uncertainty, as different hydrological models project different directions of change, which makes it difficult to identify a clear trend.

Potential evapotranspiration

Figure 7: Potential evapotranspiration projections for Chad for different GHG emissions scenarios, relative to the year 2000.

Potential evapotranspiration is the amount of water that would be evaporated and transpired if sufficient water was available at and below the land surface. Since warmer air can hold more water vapour, it is expected that global warming will increase potential evapotranspiration in most regions of the world. In line with this expectation, hydrological projections for Chad indicate a stronger rise of potential evapotranspiration under RCP6.0 than under RCP2.6 (Figure 7). Under RCP6.0, potential evapotranspiration is projected to increase by 2.1 % in 2030, 3.3 % in 2050 and 5.7 % in 2080 compared to year 2000 levels.

4 Changes are expressed relative to year 1876 temperature levels using the multi-model median temperature change from 1876 to 2000 as a proxy for the observed historical warming over that time period.