Kenya: Human health

Climate change threatens the health and sanitation sector through more frequent incidences of floods, heatwaves, droughts and storms [30]. Among the key health challenges in Kenya are morbidity and mortality through HIV / AIDS, respiratory diseases, vector-borne diseases such as malaria and impacts of extreme weather events (e.g. flooding), including injury and mortality as well as related waterborne diseases such as diarrhoea and cholera [31]. Many of these health challenges are expected to become more severe under climate change. Climate change is also likely to impact food and water supply, thereby increasing the risk of malnutrition, hunger and death by famine. Studies found a strong link between precipitation levels and child stunting, which serves as a common indicator of malnutrition: Precipitation levels impact food production, which in turn impacts food availability and ultimately growth, particularly during infancy [32]. Furthermore, the WHO estimates that 70 % of the population in Kenya is at risk of contracting malaria [33]. Climate change is likely to lengthen transmission periods and alter the geographic range of vectorborne diseases, for instance, due to rising temperatures. In this way, malaria could expand from lowland to highland areas, parts of which have been malaria free so far [34].

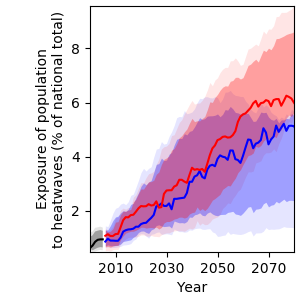
Exposure to heatwaves

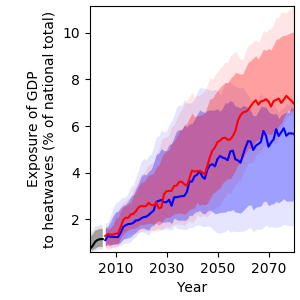
Rising temperatures will result in more frequent heatwaves in Kenya, which will increase heat-related mortality. Under RCP6.0, the population affected by at least one heatwave per year is projected to increase from 0.6 % in 2000 to 6.0 % in 2080 (Figure 18).

Figure 18: Projections of population exposure to heatwaves at least once a year for Kenya for different GHG emissions scenarios.

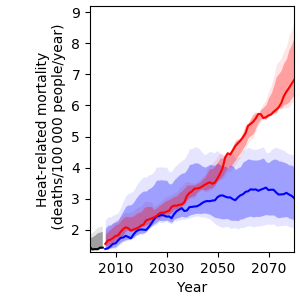
Heat-related mortality

Furthermore, under RCP6.0, heat-related mortality will likely increase from 1.4 to 6.8 deaths per 100 000 people per year, which translates to an increase by a factor of five towards the end of the century compared to year 2000 levels, provided that no adaptation to hotter conditions will take place (Figure 19). Under RCP2.6, heat-related mortality is projected to increase to 3.0 deaths per 100 000 people per year in 2080.

Figure 19: Projections of heat-related mortality for Kenya for different GHG emissions scenarios assuming no adaptation to increased heat.

References

[30] B. Simane, H. Beyene, W. Deressa, A. Kumie, K. Berhane, and J. Samet, “Review of Climate Change and Health in Ethiopia: Status and Gap Analysis,” Ethiop. J. Heal. Dev., vol. 30, no. 1, pp. 28–41, 2016.
[31] Centers for Disease Control and Prevention (CDC), “CDC in Kenya,” Atlanta, Georgia, 2016.
[32] K. Grace, F. Davenport, C. Funk, and A. M. Lerner, “Child Malnutrition and Climate in Sub-Saharan Africa: An Analysis of Recent Trends in Kenya,” Appl. Geogr., vol. 35, no. 1–2, pp. 405–413, 2012.
[33] WHO, “In Kenya, the Path to Elimination of Malaria Is Lined With Good Preventions,” 2017. Online available: https://www.who.int/news-room/feature-stories/detail/in-kenya-the-path-to-elimination-ofmalaria-is-lined-with-good-preventions [Accessed: 18-Nov-2019].
[34] USAID, “U.S. President’s Malaria Initiative: Kenya – Malaria Operational Plan FY 2019,” Washington, D.C., 2019.

Kenya: Ecosystems

Climate change is expected to have a significant influence on the ecology and distribution of tropical ecosystems, even though the magnitude, rate and direction of these changes are uncertain [28]. With rising temperatures and increased frequency and intensity of droughts, wetlands and riverine systems are increasingly at risk of being converted to other ecosystems, with plant populations being succeeded and animals losing habitats. Increased temperatures and droughts can also affect succession in forest systems while concurrently increasing the risk of invasive species, all of which affect ecosystems. In addition to these climate drivers, low agricultural production and population growth might motivate further agricultural expansion resulting in increased deforestation, land degradation and forest fires, all of which will impact animal and plant biodiversity.

Species richness

Figure 16: Projections of the aggregate number of amphibian, bird and mammal species for Kenya for different GHG emissions scenarios.

Model projections of species richness (including amphibians, birds and mammals) and tree cover for Kenya are shown in Figure 16 and 17, respectively. Projections of the number of animal species vary depending on the region and scenario (Figure 16). Since every species reacts differently to climate impacts, some areas in Kenya are projected to gain in the number of animal species, while other areas are projected to lose animal species due to climate change. The locations of projected changes shift from RCP2.6 to RCP6.0 with higher certainty under the latter. Nevertheless, a clear picture cannot be drawn.

Tree cover

Figure 17: Tree cover projections for Kenya for different GHG emissions scenarios.

With regard to tree cover, model results are clearer and more certain, especially for RCP6.0 and after 2050: Median model projections agree on an increase of tree cover by up to 9 % in south-eastern Kenya (Figure 17). This increase can be explained by the increasing precipitation levels which are projected in this region.

Although these results paint a rather positive picture for climate change impacts on tree cover, it is important to keep in mind that the model projections exclude any impacts on biodiversity loss from human activities such as land use, which have been responsible for significant losses of global biodiversity in the past, and which are expected to remain its main driver in the future [29].

References

[28] T. M. Shanahan, K. A. Hughen, N. P. McKay, J. T. Overpeck, C. A. Scholz, W. D. Gosling, C. S. Miller, J. A. Peck, J. W. King, and C. W. Heil, “CO2 and Fire Influence Tropical Ecosystem Stability in Response to Climate Change,” Nat. Publ. Gr., no. July, pp. 1–8, 2016.
[29] IPBES, “Report of the Plenary of the Intergovernmental Science-Policy Platform on Biodiversity and Ecosystem Services on the Work of Its Seventh Session,” n.p., 2019.

Kenya: Infrastructure

Climate change is expected to significantly affect Kenya’s infrastructure sector through extreme weather events, such as floods and droughts. High precipitation amounts can lead to flooding of transport infrastructure, especially in coastal areas with low altitudes, while high temperatures can cause roads, bridges and protective structures to develop cracks and degrade more quickly. This will require earlier replacement and lead to higher maintenance and replacement costs. Transport infrastructure is vulnerable to extreme weather events, yet essential for agricultural livelihoods. Roads serve communities to trade goods and access healthcare, education, credit and other services. Especially in rural areas, Kenya’s transport sector is dominated by road transport, which accounts for 99 % of non-aviation transport GHG emissions [25]. Investments will have to be made into building climate-resilient road networks.

Extreme weather events will also have devastating effects on human settlements and economic production sites, especially in urban areas with high population densities such as Nairobi or Mombasa. Informal settlements are particularly vulnerable to extreme weather events: Makeshift homes are often built in unstable geographical locations including riverbanks and coastal areas, where flooding can lead to loss of housing, contamination of water, injury or death. Dwellers usually have low adaptive capacity to respond to such events due to high levels of poverty and lack of risk-reducing infrastructures. According to a study on urban flooding in Kibera, Nairobi’s largest informal settlement with a population of more than 300 000, over 50 % of residents reported that their houses were flooded in the 2015 rainy season [26]. The study documents various consequences including death, outbreaks of cholera and diarrhoea as well as the destruction of houses and other types of property.

Despite the risk of infrastructure damage being likely to increase due to climate change, precise predictions of the location and extent of exposure are difficult to make. For example, projections of river flood events are subject to substantial modelling uncertainty, largely due to the uncertainty of future projections of precipitation amounts and their spatial distribution, affecting flood occurrence (see also Figure 5). In Kenya, projections show a slight decrease in the exposure of major roads to river floods under RCP2.6 and an increase under RCP6.0. In the year 2000, 1.9 % of major roads were exposed to river floods at least once a year, while by 2080, this value is projected to change to 2.3 % under RCP6.0 (Figure 13). In a similar way, exposure of urban land area to river floods is projected to barely change under RCP2.6, whilst increasing from 0.11 % in 2000 to 0.13 % in 2080 under RCP6.0 (Figure 14).

Figure 13: Projections of major roads exposed to river floods at least once a year for Kenya for different GHG emissions scenarios.
Figure 14: Projections of urban land area exposed to river floods at least once a year for Kenya for different GHG emissions scenarios.

The exposure of the GDP to heatwaves is projected to increase from around 0.7 % in 2000 to 5.7 % (RCP2.6) and 7.0 % (RCP6.0) by the end of the century (Figure 15). The very likely range of GDP exposure to heatwaves widens from 0.7–1.4 % in 2000 to 1.7–7.1 % (RCP2.6) and 6.7–11.1 % (RCP6.0) in 2080. Hence, it is recommended that economic policy makers start identifying heat-sensitive production sites and activities, and integrating climate adaptation strategies, such as improved solar-powered cooling systems, “cool roof” isolation materials or switching the operating hours from day to night [27].

Figure 15: Exposure of GDP in Kenya to heatwaves for different GHG emissions scenarios.

References

[25] L. Cameron, L. Würtenberger, and S. Stiebert, “Kenya’s Climate Change Action Plan: Mitigation. Chapter 7: Transport,” Nairobi, Kenya, 2012.
[26] KDI – Kounkuey Design Initiative, “Building Urban Flood Resilience: Integrating Community Perspectives, Final Report 2015–2016,” Nairobi, Kenya, 2016.
[27] M. Dabaieh, O. Wanas, M. A. Hegazy, and E. Johansson, “Reducing Cooling Demands in a Hot Dry Climate: A Simulation Study for Non-Insulated Passive Cool Roof Thermal Performance in Residential Buildings,” Energy Build., vol. 89, pp. 142–152, 2015.

Kenya: Agriculture

Smallholder farmers in Kenya are increasingly challenged by the uncertainty and variability of weather caused by climate change [21], [22]. Since most crops are rainfed, yields depend on water availability from precipitation. However, the length and intensity of the rainy season is becoming increasingly unpredictable and the use of irrigation facilities remains limited due to poor extension services and irrigation management, and lack of credit and technical equipment [23]. In 2003, only 28 % of the potential area (1 % of crop land) was irrigated [24]. The main irrigated crops are vegetables, fruit, coffee, rice and maize [23].

Crop land exposure to drought

Figure 11: Projections of crop land area exposed to drought at least once a year for Kenya for different GHG emissions scenarios.

Currently, the high uncertainty of projections regarding water availability (Figure 10) translates into high uncertainty of drought projections (Figure 11). According to the median over all models employed for this analysis, the national crop land area exposed to at least one drought per year will only slightly increase in response to gobal warming, while other models project a strong increase. Under RCP6.0, the likely range of drought exposure of the national crop land area per year widens from 0–0.8 % in 2000 to 0–1.6 % in 2080. The very likely range widens from 0–1.9 % in 2000 to 0–9.8 % in 2080. This means that some models project a fivefold increase in crop land area exposed to drought over this time period, while others project no change.

Crop yield projections

Figure 12: Projections of crop yield changes for major staple crops in Kenya for different GHG emissions scenarios assuming constant land use and agricultural management, relative to the year 2000.

Climate change will have a negative impact on yields of millet and sorghum (Figure 12)5. Compared to 2000, yields are projected to decline by 8.0 % under RCP2.6 and by 5.3 % under RCP6.0 by 2080. The stronger decrease under RCP2.6 can be explained by non-temperature related parameters such as changes in precipitation, while the weaker decrease under RCP6.0 can be explained by the CO2 fertilisation effect under higher concentration pathways, which benefits plant growth. Yields of cassava are projected to gain from climate change, with a 25 % increase under RCP6.0. Cassava is a C3 plant, which follows a different metabolic pathway than millet, sorghum and maize (C4 plants), and benefits more from the CO2 fertilisation effect. Yields of maize, wheat and cow peas are projected to decrease slightly under RCP2.6 and to not change under RCP6.0, with the exception of cow peas which are projected to increase by 10.2 % under RCP6.0. Although there appears to be almost no change in multi-model median national-level yields of maize and wheat, some models simulate considerable increases. Regional climate variability will likely cause crop yields to increase in some areas and decrease in others.

Overall, adaptation strategies such as switching to high-yielding improved varieties in climate change sensitive crops need to be considered, yet should be carefully weighed against adverse outcomes, such as a resulting decline of agro-biodiversity and a loss of local crop types.

5 Modelling data is available for a selected number of crops only. Hence, the crops listed on page 2 may differ. Maize, millet and sorghum are modelled for all countries.

References

[21] M. Herrero, C. Ringler, J. van de Steeg, P. Thornton, T. Zhu, E. Bryan, A. Omolo, J. Koo, and A. Notenbaert, “Climate Variability and Climate Change: Impacts on Kenyan Agriculture,” Washington, D.C. and Nairobi, Kenya, 2010.
[22] E. Bryan, C. Ringler, B. Okoba, C. Roncoli, S. Silvestri, and M. Herrero, “Adapting Agriculture to Climate Change in Kenya: Household Strategies and Determinants,” J. Environ. Manage., vol. 114, pp. 26–35, 2013.
[23] FAO, “Irrigation Market Brief: Kenya,” Rome, Italy, 2015.
[24] AQUASTAT, “Irrigation and Drainage Development,” 2002.

Kenya: Water resources

Climate model projections for East Africa, including Kenya, have been predicting a wetter future under climate change. Yet, recent experience shows an opposite trend with droughts occurring every three to four years and a major drought every ten years [15]. This discrepancy between model projections and experience on the ground has been termed the East African climate paradox [19]. Though different hypotheses exist, the scientific community has not yet been able to provide a reliable and comprehensive explanation for this paradox. Climate variability and the steady degradation of water resources are likely to make water availability even less predictable and limit capacities. Even areas which were known to receive high precipitation amounts and to be abundant in freshwater, such as the Mount Kenya region, experience more dry spells with rivers falling dry in an increasing frequency [20]. These changes are driven, amongst other factors, by high rates of water extraction for irrigation, livestock and domestic use, leading to conflicts between upstream and downstream water users. Lack of water availability has further been responsible for power shortages from decreased hydropower, which provides over 65 % of Kenya’s electricity, resulting in production and income losses in various sectors [15].

Per capita water availability

Figure 9: Projections of water availability from precipitation per capita and year with (A) national population held constant at year 2000 level and (B) changing population in line with SSP2 projections for different GHG emissions scenarios, relative to the year 2000.

Current projections of water availability in Kenya display high uncertainty under both GHG emissions scenarios. Assuming a constant population level, multi-model median projections suggest an increase of water availability under RCP6.0 and no change under RCP2.6 (Figure 9A). Yet, when accounting for population growth according to SSP2 projections4, per capita water availability for Kenya is projected to decline by 73 % under RCP2.6 and by 63 % under RCP6.0 by 2080 relative to the year 2000 (Figure 9B). While this decline is primarily driven by population growth rather than climate change, it highlights the urgency to invest in water saving measures and technologies for future water consumption.

Spatial distribution of water availability

Figure 10: Water availability from precipitation (runoff) projections for Kenya for different GHG emissions scenarios.

Projections of future water availability from precipitation vary depending on the region and scenario (Figure 10). Under RCP2.6, water availability will decrease by up to 25 % in western Kenya and increase by up to 25 % in southern Kenya by 2080. Most models agree on this trend. The picture is different for RCP6.0: Model agreement shifts to eastern Kenya, where water availability will increase by up to 80 %.

4 Shared Socio-economic Pathways (SSPs) outline a narrative of potential global futures, including estimates of broad characteristics such as country level population, GDP or rate of urbanisation. Five different SSPs outline future realities according to a combination of high and low future socio-economic challenges for mitigation and adaptation. SSP2 represents the “middle of the road”-pathway.

References

[15] World Bank, “Climate Variability and Water Resources in Kenya,” Washington, D.C., 2009.
[19] D. Rowell, B. Booth, S. Nicholson, and B. Good, “Reconciling Past and Future Rainfall Trends over East Africa,” J. Clim., vol. 28, no. 24, pp. 9768–9788, 2015.
[20] B. Notter, L. MacMillan, D. Viviroli, R. Weingartner, and H. P. Liniger, “Impacts of Environmental Change on Water Resources in the Mt. Kenya Region,” J. Hydrol., vol. 343, no. 3–4, pp. 266–278, 2007.

Kenya: Climate

Temperature

Figure 2: Air temperature projections for Kenya for different GHG emissions scenarios.3

In response to increasing greenhouse gas (GHG) concentrations, air temperature over Kenya is projected to rise by 1.2 to 3.2 °C (very likely range) by 2080 relative to the year 1876, depending on the future GHG emissions scenario (Figure 2). Compared to pre-industrial levels, median climate model temperature increases over Kenya amount to approximately 1.4 °C in 2030 and 1.7 °C in both 2050 and 2080 under the low emissions scenario RCP2.6. Under the medium / high emissions scenario RCP6.0, median climate model temperature increases amount to 1.3 °C in 2030, 1.6 °C in 2050 and 2.2 °C in 2080.

Very hot days

Figure 3: Projections of the annual number of very hot days (daily maximum temperature above 35 °C) for Kenya for different GHG emissions scenarios.

In line with rising mean annual temperatures, the annual number of very hot days (days with daily maximum temperature above 35 °C) is projected to rise substantially and with high certainty, in particular over central and eastern Kenya (Figure 3). Under the medium / high emissions scenario RCP6.0, the multi-model median, averaged over the whole country, projects 25 more very hot days per year in 2030 than in 2000, 36 more in 2050 and 59 more in 2080. In some parts, especially in northern and eastern Kenya, this amounts to about 300 days per year by 2080.

Sea level rise

Figure 4: Projections for sea level rise off the coast of Kenya for different GHG emissions scenarios, relative to the year 2000.

In response to globally increasing temperatures, the sea level off the coast of Kenya is projected to rise (Figure 4). Until 2050, very similar sea levels are projected under both emissions scenarios. Under RCP6.0 and compared to year 2000 levels, the median climate model projects a sea level rise by 10 cm in 2030, 21 cm in 2050, and 40 cm in 2080. This threatens Kenya’s coastal communities and may cause saline intrusion in coastal waterways and groundwater reservoirs.

Precipitation

Figure 5: Annual mean precipitation projections for Kenya for different GHG emissions scenarios, relative to the year 2000.

Future projections of precipitation are less certain than projections of temperature change due to high natural year-to-year variability (Figure 5). Out of the three climate models underlying this analysis, one model projects no change to a slight decrease in mean annual precipitation over Kenya under RCP6.0, while the other two models project an increase under the same scenario. Under RCP2.6, median model projections indicate a slight increase towards the year 2030 but an overall decrease towards the end of the century. Under RCP6.0, the projected precipitation increase is likely to intensify after 2050, reaching 53 mm per year at the end of the century compared to year 2000. Higher concentration pathways suggest an overall wetter future for Kenya.

Heavy precipitation events

Figure 6: Projections of the number of days with heavy precipitation over Kenya for different GHG emissions scenarios, relative to the year 2000.

In response to global warming, heavy precipitation events are expected to become more intense in many parts of the world due to the increased water vapour holding capacity of a warmer atmosphere. At the same time, the number of days with heavy precipitation events is expected to increase. This tendency is also found in climate projections for Kenya (Figure 6), with climate models projecting an increase in the number of days with heavy precipitation, from 7 days per year in 2000 to 9 days per year in 2080 under RCP6.0. Under RCP2.6, the number of days with heavy precipitation remains unchanged.

Soil moisture

Figure 7: Soil moisture projections for Kenya for different GHG emissions scenarios, relative to the year 2000.

Soil moisture is an important indicator for drought conditions. In addition to soil parameters and management, it depends on both precipitation and evapotranspiration and therefore also on temperature, as higher temperatures translate into higher potential evapotranspiration. Annual mean top 1-m soil moisture projections for Kenya show almost no change under either RCP (Figure 7). However, looking at the different models underlying this analysis, there is considerable year-to-year variability and modelling uncertainty, which makes it difficult to identify a clear trend.

Potential evapotranspiration

Figure 8: Potential evapotranspiration projections for Kenya for different GHG emissions scenarios, relative to the year 2000.

Potential evapotranspiration is the amount of water that would be evaporated and transpired if sufficient water was available at and below the land surface. Since warmer air can hold more water vapour, it is expected that global warming will increase potential evapotranspiration in most regions of the world. In line with this expectation, hydrological projections for Kenya indicate a stronger and more continuous rise of potential evapotranspiration under RCP6.0 than under RCP2.6 (Figure 8). Under RCP6.0, potential evapotranspiration is projected to increase by 1.9 % in 2030, 3.0 % in 2050 and 4.5 % in 2080 compared to year 2000 levels.

3 Changes are expressed relative to year 1876 temperature levels using the multi-model median temperature change from 1876 to 2000 as a proxy for the observed historical warming over that time period.