Ethiopia: Irrigation

Irrigation can help smallholder farmers to compensate for the negative impacts of erratic and insufficient precipitation and significantly stabilise agricultural production (Woldemariam & Gecho, 2017). More specifically, it can raise agricultural production, allow for greater cropping intensity and crop diversity (i.e. higher-value crops), and lengthen agricultural seasons (Awulachew, 2010; Woldemariam & Gecho, 2017). Irrigation thus serves three main adaptive purposes: 1) Increasing yields by supplying water needed, 2) reducing risk due to a more constant water supply and 3) enabling multiple harvests and cultivation of high-value cash crops, as irrigation supplies water in the dry season. 

Currently, irrigation is not wide-spread yet in Ethiopia (estimates range between 2-3 % of agricultural land, with water coming from Ethiopia’s ample surface water resources), with considerable potential to upscale its usage. Stakeholder consultations, interviews, the expert survey conducted and document analysis made clear that irrigation is a key adaptation priority in Ethiopia. The Ethiopian government is aiming to transform its agricultural sector from a subsistence mode to a market-oriented one. The potential for irrigation in Ethiopia is enormous, as it has ample surface water and groundwater resources on the one hand and land suitable for irrigation on the other hand (Woldemariam & Gecho, 2017). Twelve major river basins lie in Ethiopia, which form four main drainage systems. However, there is high spatial and temporal variability (FAO, 2005; Worqlul et al., 2015). According to various studies, there is sufficient water in Ethiopia to develop around 4.5 million hectares of agricultural land that could be irrigated through pump, gravity, pressure, underground water, water harvesting and other mechanisms (Makombe et al., 2011; Woldemariam & Gecho, 2017; Worqlul et al., 2017). The hydrological analysis in Chapter 2 also confirms this and projects ample water available for irrigation in the future.

A cost-benefit analysis of switching from rainfed maize production to irrigated maize production showed that adopting irrigation is beneficial for Ethiopian farmers. Over time, irrigation has a positive return on investment (see Figure 1).  

Figure 1: Development of the net present value from 2020 to 2050 when switching from rainfed to irrigated maize under future climate change impacts (in ETB).

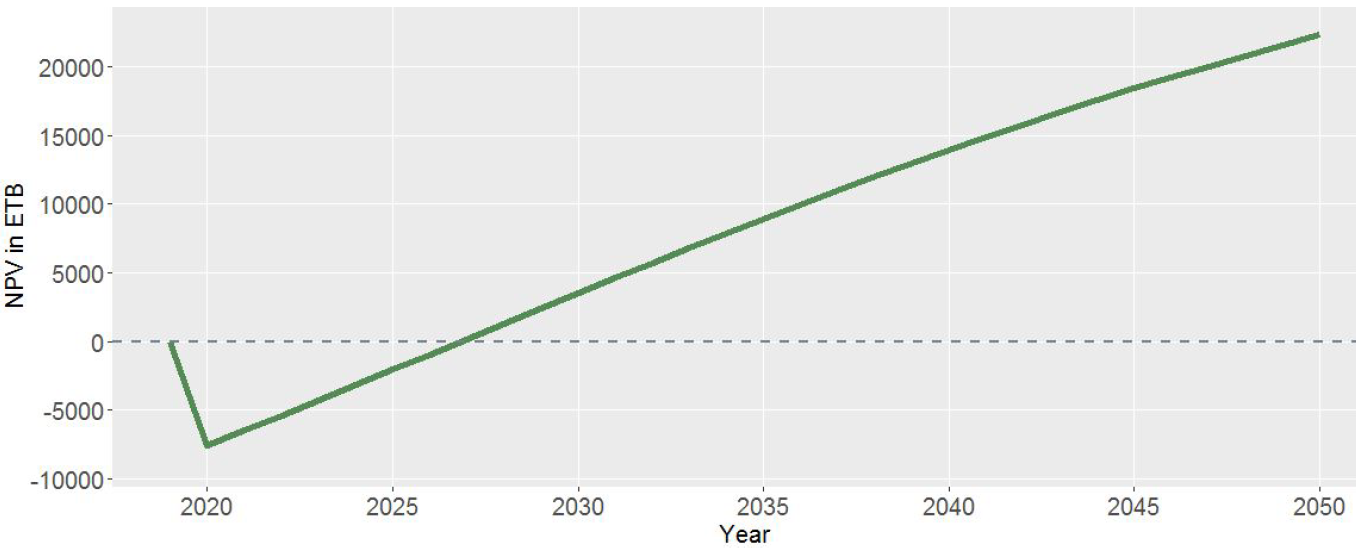
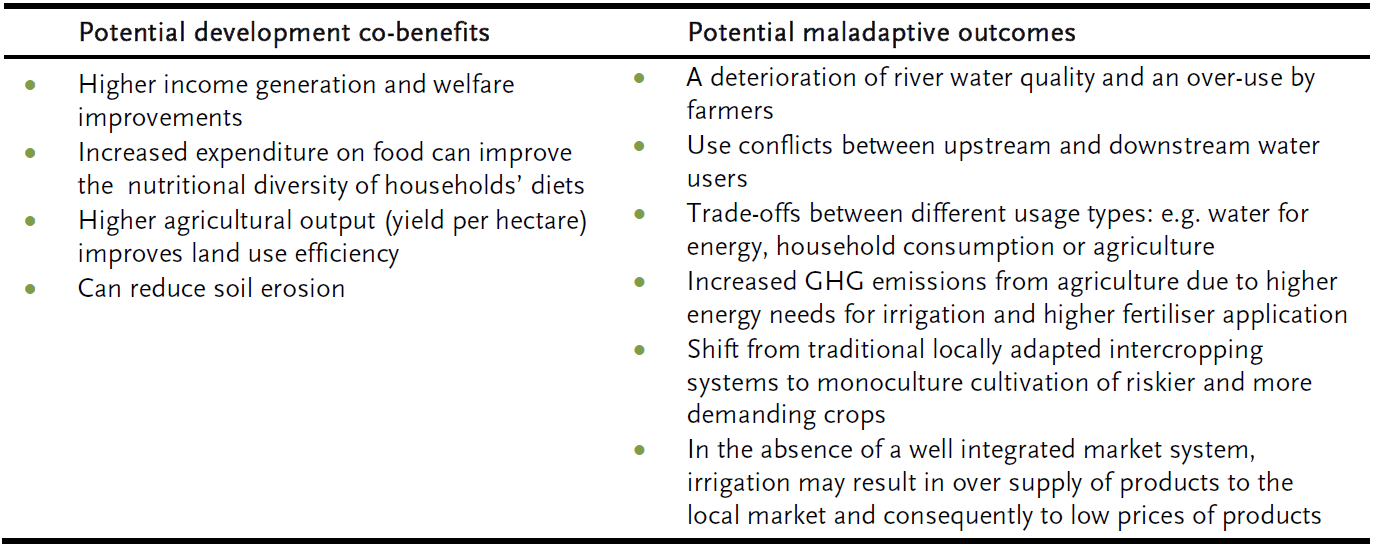
Yet, irrigation requires a considerable investment and only becomes profitable after some years, depending on the type of irrigation system and the farm location. Institutional support is usually required and care has to be taken to avoid potential maladaptive outcomes from irrigation. Table 1 gives an overview of potential co-benefits and maladaptive outcomes from adaptation in Ethiopia. 

Table 1: Potential for co-benefits and maladaptive outcomes from irrigation.

Constraints to adaptation uptake in Ethiopia include weak institutional capacity and lack of physical infrastructures, such as pumps, conveyance structures and storage facilities, but also access to electricity in rural areas (Awulachew, 2010; FAO, 2015b; Worqlul et al., 2017).

Overall, irrigation is an important adaptation strategy in Ethiopia with large potential to transform the agricultural sector and increase yields. Government support and careful policy design is needed to make implementation succeed.

Note to the reader: This evaluation is only to be viewed as a careful model‐based and expert assessment, which can by no means replace a thorough analysis for specific project design and local implementation planning. It gives an indication of the overall feasibility and suitability of the selected adaptation strategies in Ethiopia. Actual selection of adaptation strategies, however, should always be based on specific needs and interests of local communities.

References

  • Awulachew, S. B. (2010). Irrigation potential in Ethiopia Constraints and opportunities for enhancing Irrigation potential in Ethiopia Constraints and opportunities for enhancing the system International Water Management Institute Teklu Erkossa and Regassa E . Namara. IWMI Research Report.
  • FAO (UN Food and Agriculture Organization), (2005). Irrigation in Africa in figures – AQUASTAT Survey 2005, 1–14.
  • FAO, (2015b): Analysis of price incentives for red sorghum in Ethiopia for the time period 2005-2012. Rome: FAO.
  • Makombe, G., Namara, R., Hagos, F., Awulachew, S. B., Ayana, M., & Bossio, D. (2011). A com-parative analysis of the technical efficiency of rain-fed and smallholder irrigation in Ethiopia. IWMI Working Papers (Vol. 143). https://doi.org/10.5337/2011.202.
  • Woldemariam, P., & Gecho, Y. (2017). Deter-minants of Small-Scale Irrigation Use: The Case of Boloso Sore District, Wolaita Zone, Southern Ethiopia. American Journal of Agri-culture and Forestry, 5(3), 49.
  • Worqlul, A. W., Collick, A. S., Rossiter, D. G., Langan, S., & Steenhuis, T. S. (2015). Assess-ment of surface water irrigation potential in the Ethiopian highlands: The Lake Tana Basin. Catena, 129, 76–85. https://doi.org/10.1016/ j.catena.2015.02.020.
  • Worqlul, A. W., Jeong, J., Dile, Y. T., Osorio, J., Schmitter, P., Gerik, T., … Clark, N. (2017). Assessing potential land suitable for surface irrigation using groundwater in Ethiopia. Applied Geography, 85, 1–13.

Ethiopia: Human health

Climate change threatens the health and sanitation sector through more frequent incidences of heatwaves, floods, droughts and storms [30]. Among the key health challenges in Ethiopia are morbidity and mortality through temperature extremes, vectorborne diseases, such as malaria, non-vector borne diseases related to extreme weather events (e.g. flooding and droughts) such as diarrhoea and cholera, respiratory diseases, injury and mortality through extreme weather events as well as climate impacts on food and water supply, which can increase the risk of malnutrition and hunger [31]. Many of these challenges are expected to become more severe under climate change. The Ethiopian Ministry of Health estimates that already today, around 68 % of the population is at risk of contracting malaria [32]. Climate change is likely to lengthen transmission periods and alter the geographic range of vector-borne diseases, for instance, due to rising temperatures. Malaria could expand from lowland areas in Somali and Afar to highland areas in Tigray or Amhara [33].

Heatwave exposure and mortality

Rising temperatures will result in more frequent heatwaves in Ethiopia, leading to increased heat-related mortality. Under RCP6.0, the population affected by at least one heatwave per year is projected to increase from 0.3 % in 2000 to 2.1 % in 2080 (Figure 17).

Figure 17: Projections of population exposure to heatwaves at least once a year for Ethiopia for different GHG emissions scenarios.

Furthermore, under RCP6.0, heat-related mortality will likely increase from about 2 to about 6 deaths per 100 000 people per year, which translates to an increase by a factor of more than three towards the end of the century compared to year 2000 levels, provided that no adaptation to hotter conditions will take place (Figure 18). Under RCP2.6, heat-related mortality is projected to increase to about 4 deaths per 100 000 people per year in 2080.

Figure 18: Projections of heat-related mortality for Ethiopia for different GHG emissions scenarios assuming no adaptation to increased heat.

References

[30] B. Simane, H. Beyene, W. Deressa, A. Kumie, K. Berhane, and J. Samet, “Review of Climate Change and Health in Ethiopia: Status and Gap Analysis,” Ethiop. J. Heal. Dev., vol. 30, no. 1, pp. 28–41, 2016.
[31] Environmental Protection Authority of Ethiopia, “CRGE Vision: Ethiopia’s Vision for a Climate Resilient Green Economy.”
[32] Ministry of Health of Ethiopia, “Malaria Prevention & Control Program,” 2013. [Online]. Available: http://www.moh.gov.et/ejcc/en/malaria-prevention-control-program. [Accessed: 07-Oct-2019].
[33] Ministry of Water of Ethiopia, “Climate Change National Adaptation Programme of Action (NAPA) of Ethiopia,” Addis Ababa, 2007.

Ethiopia: Ecosystems

Climate change is expected to have a significant influence on the ecology and distribution of tropical ecosystems, even though the magnitude, rate and direction of these changes are uncertain [28]. Under rising temperatures, increased frequency and intensity of droughts and shorter growing periods, wetlands and riverine systems are increasingly at risk of being converted to other ecosystems with plant populations being succeeded and animals losing habitats. Increased temperatures and droughts can also influence succession in forest systems while concurrently increasing the risk of invasive species, all of which affect ecosystems. In addition to these climate drivers, reduced agricultural productivity and population growth might motivate further agricultural expansion resulting in increased deforestation, land degradation and forest fires, all of which will impact animal and plant biodiversity.

Species richness

Model projections of species richness (including amphibians, birds and mammals) and tree cover for Ethiopia are shown in Figure 15 and 16, respectively. The models applied for this analysis show particularly strong agreement on the development of animal species richness under RCP6.0: Northern Ethiopia is expected to gain up to 40 % in the number of animal species due to climate change, while eastern Ethiopia is expected to lose around 20 %.

Figure 15: Projections of the aggregate number of amphibian, bird and mammal species for Ethiopia for different GHG emissions scenarios.

Tree cover

With regard to tree cover, model results are less certain. For RCP2.6, no reliable estimates can be made. However, under RCP6.0, tree cover is projected to start changing around 2050 with more significant and certain changes towards the end of the century: Median model projections agree on an increase of tree cover by more than 10 % in the eastern part of the country (Figure 16).

Figure 16: Tree cover projections for Ethiopia for different GHG emissions scenarios.

Although these results paint an overall positive picture for climate change impacts on ecosystems and biodiversity, it is important to keep in mind that the model projections exclude any impacts on biodiversity loss from human activities such as land use, which have been responsible for significant losses of global biodiversity in the past, and which are expected to remain its main driver in the future [29].

References

[28] T. M. Shanahan et al., “CO2 and fire influence tropical ecosystem stability in response to climate change,” Nat. Publ. Gr., no. July, pp. 1–8, 2016.
[29] IPBES, “Report of the Plenary of the Intergovernmental Science-Policy Platform on Biodiversity and Ecosystem Services on the work of its seventh session,” 2019.

Ethiopia: Infrastructure

Climate change is expected to significantly affect Ethiopian infrastructure through extreme weather events, such as floods and droughts. High precipitation amounts can lead to flooding of transport infrastructure including roads, railroads and airports, while high temperatures can cause roads, bridges and protective structures to develop cracks and degrade more quickly. This will require earlier replacement and lead to higher maintenance and replacement costs [23]. Transport infrastructure is vulnerable to extreme weather events, yet essential for agricultural livelihoods. Roads serve communities to trade goods and access healthcare, education, credit and other services. Especially in rural areas, roads are the backbone of Ethiopia’s transportation network with more than 90 % of exports and imports transported by road [24]. Investments will have to be made into building climate-resilient road networks [25].

Extreme weather events will also have devastating effects on human settlements and economic production sites, especially in urban areas with high population densities like Addis Ababa, Dire Dawa or Mekelle. Informal settlements are particularly vulnerable to extreme weather events: Makeshift homes are often built in unstable geographical locations including steep slopes or river banks, where flooding can lead to loss of housing, contamination of water, injury or death. Dwellers usually have low adaptive capacity to respond to such events due to high levels of poverty and lack of risk-reducing infrastructures. For example, heavy rains in May and June 2019 have caused flooding in 38 districts across seven regions of Ethiopia, displacing 42306 families and causing livestock death and property damage [26]. Flooding and droughts will also affect hydropower generation: Ethiopia is planning to increase its hydropower capacity from 3.7 gigawatts in 2015 to a volume of 19.5 gigawatts in 2030, however, variability in precipitation and climatic conditions could severely disrupt hydropower generation [27].

Figure 12: Projections of major roads exposed to river floods at least once a year for Ethiopia for different GHG emissions scenarios.
Figure 13: Projections of urban land area exposed to river floods at least once a year for Ethiopia for different GHG emissions scenarios.

Despite the risk of infrastructure damage being likely to increase due to climate change, precise predictions on specific location and extent of exposure are difficult to make. For example, projections of river flood events are subject to substantial modelling uncertainty, largely due to the uncertainty of future projections of precipitation amounts and their spatial distribution, affecting flood occurrence (see also Figure 4). Among the models applied for this analysis, two models project only a slight increase and one model projects a stronger increase in the exposure of major roads to river floods at least once a year. The very likely range of model results indicates that road exposure to floods may increase by 70 % by 2080 (from 1.3 % of the national road network exposed in 2000 to 2.1 % in 2080). However, projections are characterised by high modelling uncertainty with median projections for RCP6.0 showing only a 0.2 % change from 2000 to 2080 (Figure 12). Hence, no reliable estimations on future occurrence of river floods can be made. Also, urban land area exposed to floods at least once a year is projected to increase (Figure 13), with a very likely range of 0.1–1.1 % by 2080 under RCP6.0.

Figure 14: Exposure of GDP in Ethiopia to heatwaves for different GHG emissions scenarios.

With the exposure of the GDP to heatwaves projected to increase from around 0.3 % in 2000 to 1.4 % (RCP2.6) and 2.8 % (RCP6.0) by the end of the century, economic policy planners are advised to start identifying heat-sensitive production sites and activities, and integrating climate adaptation strategies such as improved solar-powered cooling systems or switching the operating hours from day to night.

References

[23] Ministry of Transport of Ethiopia, “Ethiopia’s Climate Resilient Transport Sector Strategy,” Addis Ababa.
[24] EPCC, “First Assessment Report – Summary of Reports for Policy Makers,” Addis Ababa, 2015.
[25] T. Gebre and F. Nigussa, “Greenhouse Gas Emission Reduction Measures in the Urban Road Transport Sector of Ethiopia,” Environ. Prog. Sustain. Energy, vol. 38, no. 5, pp. 1–8, 2019.
[26] OCHA, “Ethiopia: Situation Report No. 23,” 2019.
[27] D. Conway, P. Curran, and K. E. Gannon, “Policy brief: Climate risks to hydropower supply in eastern and southern Africa,” no. August, 2018.

Ethiopia: Agriculture

Agriculture is amongst the sectors most exposed to climate change. Smallholder farmers in Ethiopia are increasingly challenged by the uncertainty and variability of weather that climate change causes. Since crops are predominantly rainfed (only 5 % of the national crop area is irrigated), crop yields depend on water availability and are prone to drought [4]. Climate change will have a negative impact on maize, which is the most important staple crop in terms of caloric intake, number of farmers growing it and production volume in Ethiopia [21]. Millet will also suffer from climate change impacts (Figure 11). However, actual yields for both crops will depend on the site and year as well as aggregate, regional and local drivers of crop production. Nonbiophysical factors such as access to markets will also influence production levels. Six zones are projected to experience yield losses under climate change, which are Western Tigray, South Omo, North Shewa (Amhara), Metekel, Illubabor and Gamo [22]. It should be noted that teff is another major staple crop in Ethiopia; however, due to lack of modelling data, we were unable to include it as part of our analysis.

Cropland exposure to droughts

Currently, the high uncertainty of projections regarding water availability (Figure 9) translates into high uncertainty in drought projections (Figure 10). According to the median over all models employed for this analysis, the national crop land area exposed to at least one drought per year will hardly change in response to global warming. However, there are models that project an increase in drought exposure. Under RCP6.0, the likely range of drought exposure of the national crop land area per year widens from 0.04–1.4 % in 2000 to 0.04–3.9 % in 2080. The very likely range widens from 0.01–2.3 % in 2000 to 0.01–7.1 % in 2080. This means that some models project a tripling of drought exposure over this time period, while others project no change.

Figure 10: Projections of crop land area exposed to drought at least once a year for Ethiopia for different GHG emissions scenarios.

Crop yield projections

In terms of yield projections, model results indicate a negative yield trend for maize and millet under RCP6.0. Compared to the year 2000, yields are projected to decline by 3.8 % for maize and 4.9 % for millet by 2080 under RCP6.0. Under RCP2.6, maize yields are projected to decrease only slightly and millet yields do not change. Yields of field peas, on the other hand, are projected to significantly gain from climate change. Under RCP6.0, yields are projected to increase by 17 % by 2080 relative to the year 2000. A possible explanation for the positive results under RCP6.0 is that field peas are so-called C3 plants, which follow a different metabolic pathway than maize and millet (which are C4 plants), and thus benefit more from the CO2 fertilisation effect under higher concentration pathways. Wheat is projected to slightly decrease under both RCP2.6 and RCP6.0. Although there appears to be almost no change in national-level wheat yields, it is likely that crop yields will increase more strongly in some areas and, conversely, decrease more strongly in other areas as a result of climate change impacts.

Figure 11: Projections of crop yield changes for major staple crops in Ethiopia for different GHG emissions scenarios assuming constant land use and agricultural management, relative to the year 2000.

A complimentary climate risk study for Ethiopia provides indepth information on climate impacts and selected adaptation strategies in the agricultural sector.

Overall, adaptation strategies such as switching to improved varieties in climate change sensitive crops need to be considered, yet should be carefully weighed against adverse outcomes, such as a resulting decline of agro-biodiversity and loss of local crop types.

References

[4] P. Woldemariam and Y. Gecho, “Determinants of Small-Scale Irrigation Use: The Case of Boloso Sore District, Wolaita Zone, Southern.
Ethiopia,” Am. J. Agric. For., vol. 5, no. 3, p. 49, 2017.
[21] T. Abate et al., “Factors that transformed maize productivity in Ethiopia,” Food Secur., 2015.
[22] L. Murken et al., “Climate Risk Analysis for Identifying and Weighing Adaptation Strategies in Ghana,” 2019.

Ethiopia: Water resources

Ethiopia is known as the “water tower of Africa”, having twelve river basins, 22 major lakes and a groundwater potential of about 2.6 billion m3 [19]. However, rapid population growth and future variability of water resources can affect the economy through a growing energy and water demand in different sectors including agriculture, infrastructure, ecosystems and health. Precipitation strongly depends on elevation: It currently ranges from 1900 mm per year in the highlands to around 100 mm per year in low-lying areas [15]. Agricultural production follows these precipitation patterns. However, areas with high agricultural production also coincide with high population density and pressure on land, especially in the weyna dega (warm to cool climate) and dega (cool climate) zones that are best suited for the production of major staple crops in Ethiopia [20].

Per capita water availability

Figure 8: Projections of water availability from precipitation per capita and year with (A) national population held constant at year 2000 level and (B) changing population in line with SSP2 projections for different GHG emissions scenarios, relative to the year 2000.

Current projections for water availability in Ethiopia display high uncertainty under both GHG emissions scenarios. Assuming a constant population level, multi-model median projections suggest no change in per capita water availability over Ethiopia by the end of the century under RCP2.6 and only a slight increase under RCP6.0 (Figure 8A). Yet, when accounting for population growth according to SSP2 projections6, per capita water availability for Ethiopia is projected to decline by 65 % by 2080 relative to the year 2000 under both scenarios (Figure 8B). While this decline is driven primarily by population growth, rather than climate change, it highlights the urgency to invest in water saving measures and technologies for future water consumption.

Spatial distribution of water availability

Figure 9: Water availability from precipitation (runoff) projections for Ethiopia for different GHG emissions scenarios.

Projections of future water availability from precipitation vary depending on the region and scenario (Figure 9). Under RCP2.6, water availability will decrease by up to 30 % in southern Ethiopia and increase by up to 35 % in eastern Ethiopia by 2080. All models agree on this trend, making water saving measures in these regions particularly important after 2050. However, the picture is different for RCP6.0, where projections for the south and east of Ethiopia are less certain and the projected difference in water availability is smaller, which is why a clear trend cannot be identified.

6 Shared Socio-economic Pathways (SSPs) outline a narrative of potential global futures, including estimates of broad characteristics such as country-level population, GDP or rate of urbanisation. Five different SSPs outline future realities according to a combination of high and low future socio-economic challenges for mitigation and adaptation. SSP2 represents the “middle of the road”-pathway.

References

[19] D. Mulugeta, D. Weijun, and J. H. Zhao, “Hydropower for sustainable water and energy development in Ethiopia,” Sustain. Water Resour. Manag., vol. 1, no. 4, pp. 305–314, 2015.
[20] J. Chamberlin and E. Schmidt, “2 Ethiopian Agriculture: A Dynamic Geographic Perspective,” in Food and Agriculture in Ethiopia, 2014.

Ethiopia: Climate

Temperature

Figure 2: Air temperature projections for Ethiopia for different GHG emissions scenarios.5

In response to increasing greenhouse gas (GHG) concentrations, air temperature over Ethiopia is projected to rise by 1.6 to 3.7 °C (very likely range) by 2080 relative to the year 1876, depending on the future GHG emissions scenario (Figure 2). Compared to pre-industrial levels, median climate model temperature increases over Ethiopia amount to approximately 1.5 °C in 2030, 1.8 °C in 2050 and 1.8 °C in 2080 under the low emissions scenario RCP2.6. Under the medium / high emissions scenario RCP6.0, median climate model temperature increases amount to 1.5 °C in 2030, 1.8 °C in 2050 and 2.4 °C in 2080.

Very hot days

Figure 3: Projections of the annual number of very hot days (daily maximum temperature above 35 °C) for Ethiopia for different GHG emissions scenarios.

In line with rising mean annual temperatures, the annual number of very hot days (days with daily maximum temperature above 35 °C) is projected to rise substantially and with high certainty, in particular over eastern Ethiopia (Figure 3). Under the medium / high emissions scenario RCP6.0, on average over all Ethiopia, the multi-model median projects 18 more very hot days per year in 2030 than in 2000, 26 more in 2050 and 50 more in 2080. In some parts, especially in eastern Ethiopia, this amounts to about 200 days per year by 2080.

Precipitation

Figure 4: Annual mean precipitation projections for Ethiopia for different GHG emissions scenarios, relative to the year 2000.

Future projections of precipitation are less certain than projections of temperature change due to high natural year-to-year variability (Figure 4). Out of the three climate models underlying this analysis, one model projects almost no change in mean annual precipitation over Ethiopia, while the other two models project an increase. Median model projections for RCP2.6 show almost no change in total precipitation per year until 2080, while median model projections for RCP6.0 show a precipitation increase of 85 mm / year by 2080 compared to year 2000.

Heavy precipitation events

Figure 5: Projections of the number of days with heavy precipitation over Ethiopia for different GHG emissions scenarios.

In response to global warming, extreme precipitation events are expected to become more intense in many parts of the world due to the increased water vapour holding capacity of a warmer atmosphere. At the same time, the number of days with heavy precipitation events is expected to increase. This tendency is also found in climate projections for Ethiopia (Figure 5), with climate models projecting a slight increase in the number of days with heavy precipitation events, from 7 days / year in 2000 to 8 days / year in 2080 under RCP2.6 and 9 days / year under RCP6.0 by 2080.

Soil moisture

Figure 6: Soil moisture projections for Ethiopia for different GHG emissions scenarios, relative to the year 2000.

Soil moisture is an important indicator for drought conditions. In addition to soil parameters, it depends on both precipitation and evapotranspiration and therefore also on temperature as higher temperatures translate to higher potential evapotranspiration. Annual mean top 1-m soil moisture projections for Ethiopia show almost no change to a slight decrease for RCP2.6, while under RCP6.0, soil moisture is projected to slightly increase approaching a 1 % change by 2080 compared to the year 2000 (Figure 6). However, looking at the different models underlying this analysis, there is large year-to-year variability and modelling uncertainty, which makes it difficult to identify a clear trend.

Potential evapotranspiration

Figure 7: Potential evapotranspiration projections for Ethiopia for different GHG emissions scenarios, relative to the year 2000.

Potential evapotranspiration is the amount of water that would be evaporated and transpired if sufficient water were available at and below land surface. Since warmer air can hold more water vapour, it is expected that global warming will increase potential evapotranspiration in most regions of the world. In line with this expectation, hydrology projections for Ethiopia indicate a stronger and more continuous rise of potential evapotranspiration under RCP6.0 than under RCP2.6 (Figure 7). Under RCP6.0, potential evapotranspiration is projected to increase by 2.0 % in 2030, 2.7 % in 2050 and 4.4 % in 2080 compared to year 2000 levels.

5 Changes are expressed relative to year 1876 temperature levels using the multi-model median temperature change from 1876 to 2000 as a proxy for the observed historical warming over that time period.

Ghana: Improved crop varieties

Smallholder farmers in the global South mostly use traditional crop varieties, which can be vulnerable to climate impacts such as droughts, floods or also diseases. In order to improve the resilience of crops to climatic shocks and to raise yields, improved crop varieties are bred from traditional varieties. The process of breeding is lengthy and costly, but once better varieties are released and used, they can substantially improve agricultural yields and resilience, depending on their specific characteristics. As such, breeding improved varieties is an institution-led approach, since it requires resources and time, which smallholder farmers most often do not have.

Improved crop varieties can offer a number of interesting development co-benefits, especially linked to increased agricultural production and income. However, they are expensive to develop:  a multitude of factors will determine prices of the seeds, such as demand, scale of adoption, and – for farmers – potential government subsidies

A number of improved crop varieties already exist or are being developed in Ghana, for instance for maize, rice, cassava and cocoa, with sought-after properties being drought resistance, flood resistance and achievement of high yields. Maize appears to be the focus of breeding efforts in Ghana, as several publications (e.g. Alhassan, Salifu & Adebanji, 2016; Danso-Abbeam et al., 2017) and the number of active breeders for maize (10 out of 26) confirm (Mabaya et al., 2017).

An analysis conducted using the biophysical crop model APSIM shows that improved maize varieties indeed hold large potential for increasing yields under climate change (Figure 3). However, the size of the effect and sometimes even direction depends on the location, with the impact in different districts in Ghana differing considerably. Compared to no adaptation and other agronomic adaptation measures such as applying manure or delaying the sowing date, a carefully selected improved variety may indeed have a larger impact on increasing maize yields.

Table 1: Impact of agronomic adaptation measures on maize yield under climate change for three districts in Ghana (average yield projection for 2050 compared to 2006 baseline).

Another analysis conducted with machine-learning based crop suitability models shows how generally the effect of agronomic adaptation strategies varies considerably across crops. While maize and cassava appear to benefit from many agronomic adaptation strategies under climate change, for sorghum this is much more the case under the high-emission climate scenario (RCP8.5) and for groundnut, none of the adaptation strategies proposed has a positive effect.

Figure 3: Projected effects of different adaptation options on crop suitability for cassava, groundnut, maize and sorghum under RCP2.6 and RCP8.5. The adaptation options analysed are: a two-week shift in the growing season (beige), a four-week shift in the growing season (red), increasing soil organic carbon by 10% (brown), a combination of shifting the growing season by two weeks and increasing soil organic carbon by 10% (grey) and a combination of shifting the growing season by four weeks and enhancing soil organic carbon by 10% (mint).

Agronomic adaptation strategies and the use of improved seeds should thus be carefully evaluated for each specific region, crop and climate impact scenario. Nonetheless, improved crop varieties are seen as a transformative tool for buffering climate impacts in Ghanaian agriculture. Breeding is costly and time intensive, but where improved varieties already exist, they can contribute importantly to a higher agricultural output.

References

  • Alhassan, A., Salifu, H., & Adebanji, A. O., (2016). Discriminant analysis of farmers’ adoption of improved maize varieties in Wa Municipality, Upper West Region of Ghana. SpringerPlus, 5(1).
  • Danso-Abbeam, G., Bosiako, J. A., Ehiakpor, D. S., & Mabe, F. N., (2017). Adoption of improved maize variety among farm households in the northern region of Ghana. Cogent Economics and Finance, 5(1), 1–14.
  • Mabaya, E., Adzivor, S. Y., Wobil, J., & Mugoya, M., (2017). Ghana Brief 2017 – The African Seed Access Index, (December).

Ghana: Rainwater harvesting

Rainwater harvesting (RWH) allows storing irrigation water for critical times in the growing period of otherwise rain-fed crops. It is also a promising practice for reducing costs for irrigation uptake as its installation is considerably cheaper than building groundwater irrigation infrastructure.

In Ghana, limited evidence on the use and potential of RWH for small-scale irrigation systems exists. Even though Ghana has abundant water resources for irrigation, its uptake is very low. RWH can provide a cost-efficient alternative to irrigation installment and is notably a strategy with usage potential at different scales. It is particularly well suited to be coupled with farm-level horticulture production, either for additional income from vegetable sales or satisfying changing demands in household consumption (for Sub-Saharan Africa as a whole, see e.g. OECD & FAO, 2016). This could also yield nutritional and thus health benefits, with vegetables enriching otherwise staple-based diets in Ghana. A combination with conservation agriculture techniques can be particularly useful, with further improvements in soil water storage capacity enhancing the water use efficiency of RWH.

In addition, RWH has the potential to deliver gender co-benefits. Since it is usually women who are in charge of fetching water and who engage in backyard vegetable farming, collecting rainwater could save women time, making time for other activities and enabling additional farming activities.

Rainwater harvesting and small-scale irrigation are a good alternative for action at smallholder level, with simple installation techniques proving less difficult to implement, maintain and refinance as compared to large-scale irrigation systems.

Thus, RWH is a promising adaptation strategy meeting local interest in Ghana. It can be implemented by farmers autonomously and decrease dependency on precipitation.

References

  • OECD/FAO, (2016). Agriculture in Sub-Saharan Africa: Prospects and challenges for the next decade, in OECD-FAO Agricultural Outlook 2016-2025, OECD Publishing, Paris. https://dx.doi.org/10.1787/agr_outlook-2016-5-en.

Ghana: Irrigation

In areas short of precipitation, irrigation can be a key strategy to enable plant growth and increase yields. Water can be drawn from different sources, such as groundwater, surface water and in some countries even desalinated seawater, to enable a better growth of plants. Irrigation schemes at smaller scale can be initiated and implemented by farmers themselves, but for larger irrigation installations, technical agencies and extension officers play an important role.

As of yet, irrigation is not widely spread in Ghana, with only an estimated 1.6% of the area with a respective potential actually being irrigated (Mendes, Paglietti & Jackson, 2014), mostly for rice and horticulture cultivation (Namara et al., 2011). This limited uptake implies that further installation of irrigation schemes is possible and could increase Ghana’s agricultural production. However, this may incur high costs and technically challenging installation and maintenance. As a climate change adaptation strategy, the case for irrigation depends on the climate scenario, with the North of Ghana projected to see less rainfall under future climate change. However, as a measure to intensify agricultural production and enable multiple harvests, irrigation can also be considered useful today, where water is available for agricultural use.

Figure 2 shows the net value of maize production in the whole of Ghana under different irrigation scenarios, reflecting the varying costs that different irrigation techniques and installations incur. As can be seen from the comparison with the baseline scenario and the scenario under climate change, not all irrigation scenarios are able to offset the losses projected under climate change.

Figure 2: Net value of maize production in Ghana under different irrigation scenarios (in million USD), compared to no adaptation and no climate change.

In sum, while irrigation has the potential to increase agricultural production in Ghana, it is also a costly strategy, often requiring institutional support for implementation and maintenance.

References

  • Mendes, D.M, Paglietti, L. & Jackson, D., (2014). Ghana: Irrigation market brief. Food and Agri-culture Organization of the United Nations. Rome.
  • Namara, R., Horowitz, L., Nyamadi, B. & Barry, B., (2011). Irrigation Development in Ghana: Past experiences, emerging opportunities, and future directions, International Food Policy Research Institute, GSSP Working Paper No. 27, Ghana Strategy Support Program, Accra.