Burkina Faso: Improved crop varieties

One option to help farmers increase the productivity of soil, water, nutrients and other resources is the genetic improvement of crops under stress and optimal growing conditions (IPCC, 2019; Searchinger et al., 2014; Voss-Fels et al., 2019). An improved or modern variety is a new variety of a plant species which produces higher yields, higher quality or provides better resistance to plant pests and diseases, while minimizing the pressure on the natural environment (Access to Seeds Index, 2020). Such modern varieties are genetically uniform, which means that their characteristics are constant within all individuals of that specific variety. The exact definition and requirements of improved varieties depend on a country’s legislation and international treaties (e.g. harmonized Seed Regulation adopted by ECOWAS). Improved varieties have, for example, higher tolerances to abiotic stressors, such as drought (Fisher et al., 2015), resistances to biotic stressors (e.g. diseases and pests), improved resource use or other changes that permit altering the agronomic management by, for example, needing shorter growing cycles. Along with labour saving technologies and flexible credits, locally adapted seed varieties are among the most needed inputs for farmers in Burkina Faso (Roncoli et al., 2001).

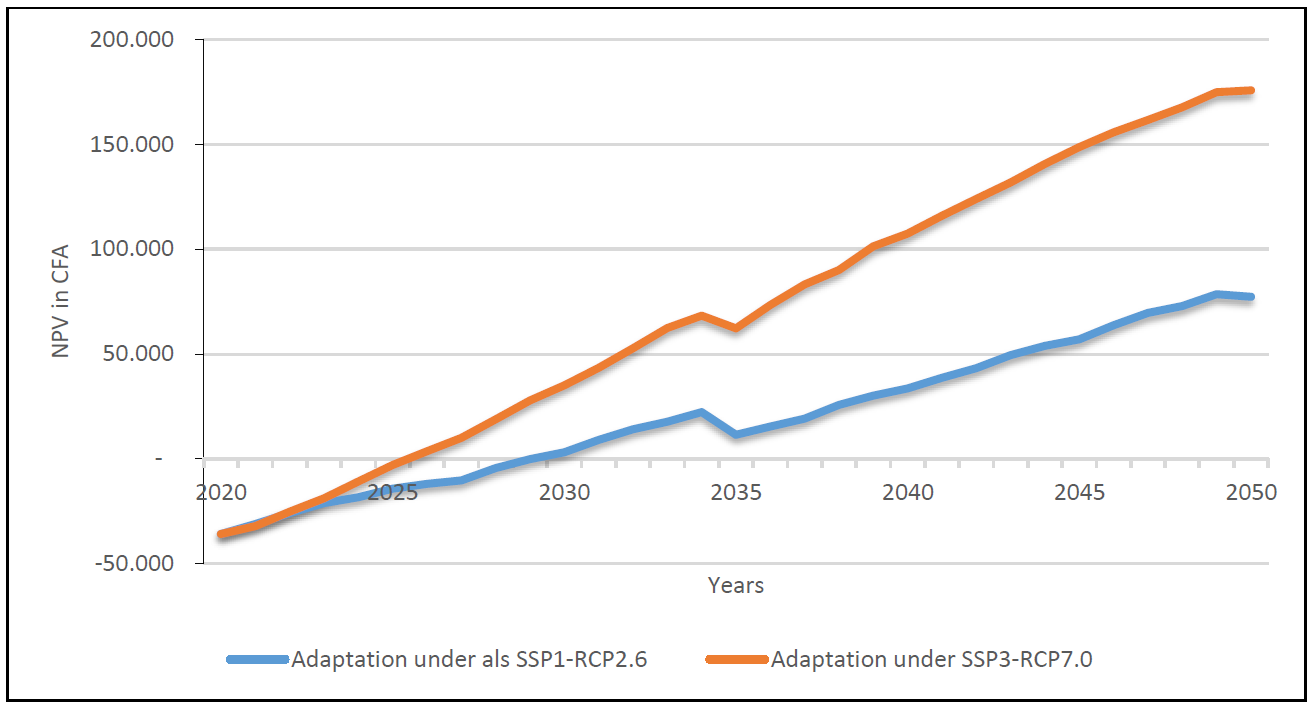
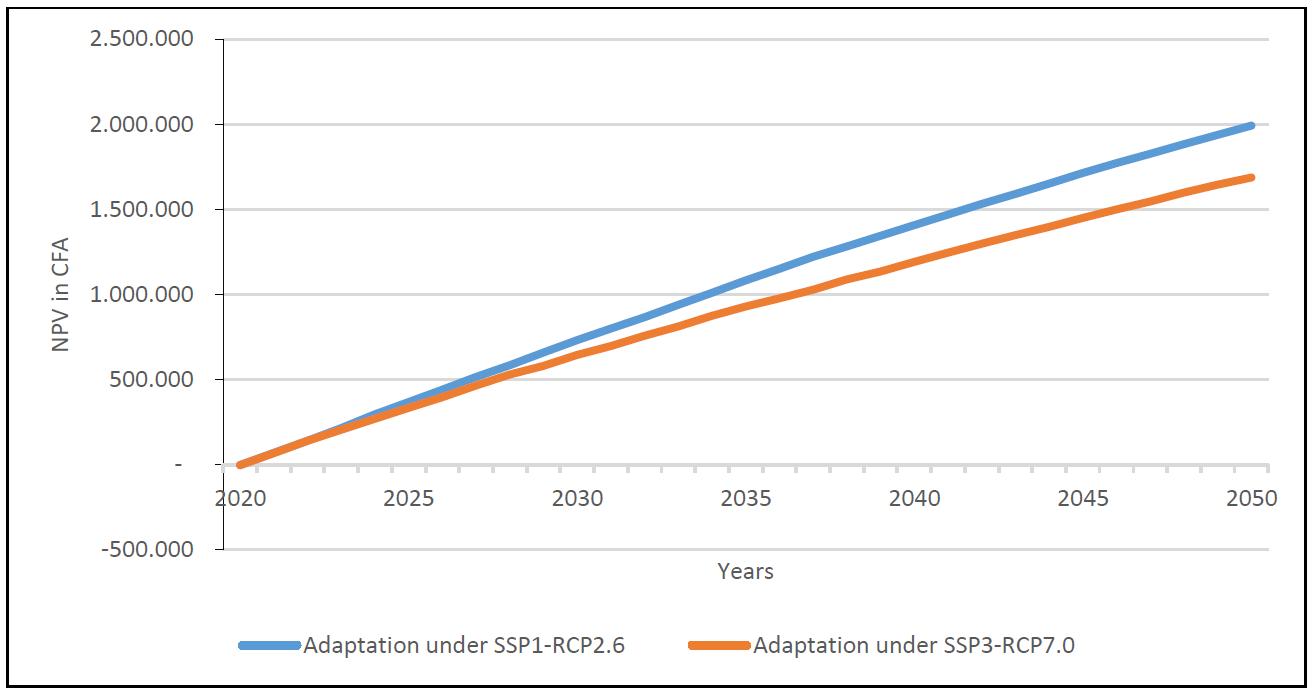
Improved crop varieties are a highly beneficial adaptation strategy in Burkina Faso. Furthermore, the cost-benefit analysis shows a very positive return on a rather small-scale investment (see Figure 1). Due to its positive impact on yield increase and stability as well as increased levels of nutrients, improved varieties can also help to decrease malnutrition and undernutrition. However, there are several factors, such as high prices of agricultural inputs, the insufficiency of logistical and financial support, the poor organization of the sector, the lack of motivation by seed producers to enter the market, the climatic risks associated with agricultural production and a decline in soil fertility, which impede the use of improved seeds by farmers. Besides that, insufficient agronomic knowledge or non-locally adapted varieties can lead to controversial effects and negative outcomes of this strategy.

To achieve the optimal adaptation effect of improved varieties, the following recommendations should be considered:

  • Ideally, improved varieties are promoted that fulfil several conditions, such as farmers’ preferences, local suitability, agronomic management and that are available and accessible for smallholder farmers. The sufficient supply of locally adapted good quality seeds on the local level should be, therefore, supported.
  • To promote a continuing process of innovation adoption, efforts should be directed to creating a seed sector that covers the overall process for improved seeds from plant breeding and pre-breeding to seed propagation, marketing and advisory, whilst focusing on farmers’ needs.
  • Knowledge transfer regarding the varieties’ potential and the best way to cultivate them can help farmers to use improved varieties.
  • For a profitable adoption it is necessary to ameliorate the functioning of the agricultural value chain including functioning infrastructure and agriculture markets to make agricultural inputs available and accessible.
  • It is also important to highlight the value of local landraces, as they are a pillar for safeguarding local traditions, agronomic practices and accompanying knowledge. Such a safeguarding of seeds and practices could be institutionalized by in-situ conservation projects, local seed banks, corporations with national or international gene banks and diversity fairs.
  • A better communication and interaction of seed sector stakeholders can help to improve seed and knowledge dissemination on a local, regional and national level.
Figure 1: Development of the net present value of switching to sorghum cultivation using ICV, Source: Own figure based on own calculations.

References

  • Access to Seeds Index. (2020). Definitions. https://www.accesstoseeds.org/definitions/
  • Fisher, M., Abate, T., Lunduka, R. W., Asnake, W., Alemayehu, Y., & Madulu, R. B. (2015). Drought tolerant maize for farmer adaptation to drought in sub-Saharan Africa: Determinants of adoption in eastern and southern Africa. Climate Change, 133(2), 283–299. https://doi.org/10.1007/s10584-015-1459-2
  • IPCC. (2019). Climate Change and Land: An IPCC special report on climate change, desertification, land degradation, sustainable land management, food security, and greenhouse gas fluxes in terrestrial ecosystems. Intergovernmental Panel on Climate Change.
  • Ishikawa, H., Drabo, I., Joseph, B., Batieno, B., Muranaka, S., Fatokoun, C., & Boukar, O. (2020). Characteristics of farmers’ selection criteria for cowpea (Vigna unguiculata) varieties differ between north and south regions of Burkina Faso. Ex. Agric, 56(1), 94–103. https://doi.org/10.1017/S001447971900019X
  • Roncoli, C., Ingram, K., & Kirshen, P. (2001). (2001): The costs and risks of coping with drought: Livelihood impacts and farmers’ responses in Burkina Faso. Clim. Res., 19, 119–132. https://doi.org/10.3354/cr019119
  • Searchinger, T., Hanson, C., & Lacape, J.-M. (2014). Crop Breeding: Renewing the Global Commitment. WRI.
  • Voss-Fels, K. P., Stahl, A., Wittkop, B., Lichthardt, C., Nagler, S., Rose, T., Chen, T.-W., Zetzsche, H., Seddig, S., Baig, M. M., Ballvora, A., Frisch, M., Ross, E., Hayes, B. J., Hayden, M. J., Ordon, F., Leon, J., Kage, H., Friedt, W., … Snowdon, R. J. (2019). Breeding improves wheat productivity under contrasting agrochemical input levels. Nature Plants, 5(7), 706–714. https://doi.org/10.1038/s41477-019-0445-5

Burkina Faso: Integrated soil fertility management

Burkina Faso faces natural soil poverty as well as a continuous decline in soil fertility due to the overexploitation of land, soil and water resources caused by population growth and the corresponding demand for food. Poor management practices (e.g. bush burning) often result in soil erosion and the subsequent loss of topsoil, thereby further limiting land suitable for crop production (Nyamekye et al., 2018). The increasing occurrence of droughts presents an additional stressor for soils, contributing to land degradation and reduced soil fertility.

Integrated soil fertility management, commonly referred to as ISFM, can help to secure agricultural outputs under those conditions and has been promoted in Burkina Faso for several decades (Zougmoré et al., 2004). Considered a key factor in improving low soil and crop productivity in Africa, ISFM is defined as “a set of soil fertility management practices that necessarily include the use of fertiliser, organic inputs and improved germplasm, combined with the knowledge on how to adapt these practices to local conditions in aim of maximizing the agronomic use efficiency of the applied nutrients and improving crop productivity. All inputs need to be managed following sound agronomic principles” (Vanlauwe et al., 2010). ISFM is not characterised by specific field practices, but is “a fresh approach to combining available technologies in a manner that preserves soil quality while promoting its productivity” (Sanginga & Woomer, 2009). ISFM requires interventions to be aligned with prevalent biophysical and socio-economic conditions at farm and plot level (Vanlauwe et al., 2015). Typical for drylands, ISFM in Burkina Faso is based on the following objectives: 1) maximising water capture and decreasing runoff, 2) reducing water and wind erosion, 3) managing limited available organic resources and 4) strategically applying mineral fertilisers (Sanginga & Woomer, 2009). Suitable interventions include, for example, Zaï, half-moons, stone bunds, filter bunds, grass strips and mulching.

ISFM is a promising adaptation strategy under all future climate change scenarios, supporting the rehabilitation of soil where it is degraded and increasing the plant diversity in Burkina Faso. At present, ISFM is mostly used in central and northern Burkina Faso, however, the technology could be beneficial for all regions in the country to manage soil moisture and fertility, partly due to its rather small-scale initial investment. This is also reflected in the results of the cost-benefit analysis which show that implementing ISFM techniques would be beneficial for the farmers (see Figure 1).

The following recommendations can thus be given for Burkina Faso:

  • Awareness raising and training on the advantages and implementation of ISFM to support the effectiveness of this strategy which is relatively time consuming for farmers. The consideration of the technology in education and extension programs can also help to support the effective dissemination.
  • Policies towards sustainable land use intensification, as well as the rehabilitation of degraded soils and the necessary mechanisms to implement and evaluate these can help to promote the uptake of ISFM.
  • Research on innovative ISFM practices as well as the dissemination of the results can improve the effectiveness of the technology and further strengthen the adoption rate.
  • The public sector can play an important role in creating a platform for bringing together and linking key partners in research, education, extension, service providers, input providers, and farmers to facilitate farmer mobilisation and capacity development.
  • Policies that incentivise credit and loan schemes and subsidy programmes for the production of organic inputs could address the issue of lack of access to equipment and input.
Figure 1: Development of the net present value of switching to sorghum cultivation using ISFM, Source: Own figure based on own calculations.

References

  • Nyamekye, C., Thiel, M., Schönbrodt-Stitt, S., Zoungrana, B. J. B., & Amekudzi, L. K. (2018). Soil and Water Conservation in Burkina Faso, West Africa. Sustainability, 10(9), 1–24. https://doi.org/10.3390/su10093182
  • Sanginga, N., & Woomer, P. L. (2009). Integrated Soil Fertility Management in Africa—Principles, Practices and Development Process. Tropical Soil Biology and Fertility Institute of the International Centre for Tropical Agriculture (TSBF-CIAT).
  • Vanlauwe, B., Bationo, A., Chianu, J., Giller, K. E., Merckx, R., Mokwunye, U., Ohiokpehai, O., Pypers, P., Tabo, R., Shepherd, K. D., Smaling, E. M. A., Woomer, P. L., & Sanginga, N. (2010). Integrated Soil Fertility Management: Operational Definition and Consequences for Implementation and Dissemination. Outlook on Agriculture, 39(1), 17–24. https://doi.org/10.5367/000000010791169998
  • Vanlauwe, B., Descheemaeker, K., Giller, K. E., Huising, J., Merckx, R., Nziguheba, G., Wendt, J., & Zingore, S. (2015). Integrated soil fertility management in sub-Saharan Africa: Unravelling local adaptation. Soil, 1, 491–508.
  • Zougmoré, R., Ouattara, K., Mando, A., & Ouattara, B. (2004). Rôle des nutriments dans le succès des techniques de conservation des eaux et des sols (cordons pierreux, bandes enherbées, zaï et demi lunes) au Burkina Faso. Science et Changements Planétaires/ Sécheresse, 15(1), 41–48.

Burkina Faso: Irrigation

The agricultural sector in Burkina Faso is heavily dependent on water from precipitation. Since precipitation is increasingly erratic, irrigation can help farmers to adapt to these changing conditions. Irrigation can be defined as the artificial process of applying water to crops or land in order to support plant growth. The FAO distinguishes between three types of irrigation: (1) surface irrigation, where water flows over the land; (2) sprinkler irrigation, where water is sprayed under pressure over the land; and (3) drip irrigation, where water is directly brought to the plant (FAO, 2001).

Irrigation is a promising adaptation strategy in Burkina Faso. Irrigation can help smallholder farmers to compensate for the negative impacts of erratic and insufficient precipitation and significantly stabilise agricultural production. The results of the cost-benefit analysis show that under both emissions scenarios switching from rainfed to irrigated production of maize has a positive return on investment (see Figure 1). However, water retention, which is essential for the used irrigation systems in Burkina Faso, is dependent on seasonal variation and specific location which influence the accessibility and effect of irrigation. Besides, irrigation requires a significant investment and only becomes profitable after some years, depending on the type of irrigation system and the farm location. Continuous institutional support is usually required and care has to be taken to avoid potential maladaptive outcomes from irrigation. Water use for irrigation has to be carefully managed to prevent groundwater table decrease and associated consequences.

Specific recommendations regarding irrigation in Burkina Faso are:

  • Low-cost irrigation options with low maintenance requirements can be promoted across Burkina Faso, where water resources are available.
  • Awareness raising about water-saving irrigation management is crucial to ensure a long-term responsible use of natural resources.
  • Ideally, water saving equipment, such as drip irrigation and smart irrigation systems, are promoted and supported by extension services to encourage farmers to use sustainable and environmentally responsible techniques.
  • Provision of support services is needed to ensure the ability of farmers to further operate the technology and take care of their maintenance.
  • For upscaling irrigation, all user interests in water and energy should be carefully considered. Dispute settlement mechanisms can be implemented to address potential conflicts between upstream and downstream users.
  • Developing financing mechanism, such as access to loans or credits, can support the accessibility for irrigation equipment.
Figure 1: Development of the net present value of switching to rainfed maize cultivation under supplementary irrigation, Source: Own figure based on own calculations.

References

  • FAO. (2001). Irrigation Manual: Planning, Development, Monitoring and Evaluation of Irrigated Agriculture with Farmer Participation. FAO.

Burkina Faso: Climate information

Information and knowledge exchange are key to managing climate risks and mitigating climate-related impacts on agricultural crops, water resources and food security. Climate information services (CIS) can help to bridge existing information and knowledge gaps. Tall (2013) defines CIS as a timely decision aide based on climate information that assists individuals and organisations to improve ex-ante planning, policy and practical decision-making. CIS thus include the production, translation, dissemination and use of climate information for different target audiences, usually in climate-sensitive sectors, such as agriculture, water, health or disaster risk reduction (Carr, et al., 2020; Tall, 2013). According to Zongo et al. (2015), CIS usually provide seasonal estimates of the starting and ending dates of the rainy season, the length of the rainy season, the number of days with precipitation, the annual cumulative precipitation, and the average and maximum duration of dry spells during the rainy season.

Several studies have shown the positive impact of CIS on crop yields which underlines its great potential as an adaptation strategy. Having access to actionable climate information can help farmers to make informed decisions and thereby reduce the impact of climate risks. With a rather small-scale investment and its positive return, CIS represents a highly beneficial strategy. However, setting up well-functioning CIS requires high institutional and technical support.

Based on the literature review, multi-criteria assessment and CBA (see Figure 1), specific recommendations can be given to support the implementation of CIS:

  • Awareness raising campaigns can help to inform farmers and rural communities about the great advantage of CIS and gain trust in the information received. Trainings on CIS can help farmers and especially rural women to fully understand the communicated information and to be able to act on it. Ensuring that women and other minority groups have equal access to CIS can help to promote gender equality in agricultural production.
  • For now, existing communication channels (radio, television, word of mouth) represent the most effective way for CIS upscaling but new information channels (mobile phones, smartphones, internet-based devices) and sources are being developed throughout Burkina Faso and should be considered to reach maximum coverage.
  • Access to modern information and communication technology (e.g. smartphone, internet) should be supported.
  • CIS should be targeted to the various end-users needs. An analysis along the whole value chain and gender-disaggregated data can help to identify those needs and develop target-oriented formats and make communication more effective.
  • When disseminating information through CIS it is crucial to ensure timely and actionable communication in the local language(s) and effective use of e.g. visualisation and audio formats to overcome the access barrier for poor educated or illiterate people.
Figure 1: Development of the net present value of switching to rainfed maize cultivation using climate information, Source: Own figure based on own calculations.

References

  • Carr, E. R., Goble, R., Rosko, H. M., Vaughan, C., & Hansen, J. (2020). Identifying Climate Information Services Users and Their Needs in Sub-Saharan Africa: A Review and Learning Agenda. Climate and Development, 12(1), 23–41. https://doi.org/10.1080/17565529.2019.1596061
  • Tall, A. (2013). What Do We Mean by Climate Services? WMO Bulletin.
  • Zongo, B., Diarra, A., Barbier, B., Zorom, M., Yacouba, H., & Dogot, T. (2015). Farmers’ Perception and Willingness to Pay for Climate Information in Burkina Faso. Journal of Agricultural Science, 8(1), 175. https://doi.org/10.5539/jas.v8n1p175

Madagascar: Human health

Climate change threatens the health and sanitation sector through more frequent incidences of heatwaves, floods, droughts and storms, including cyclones. Among the key health challenges in Madagascar are morbidity and mortality through vector-borne diseases such as malaria, waterborne diseases related to extreme weather events (e.g. flooding) such as diarrhoea, respiratory diseases, tuberculosis and HIV [32]. Climate change also impacts food and water supply, thereby increasing the risk of malnutrition, hunger and death by famine. Many of these challenges are expected to become more severe under climate change. According to the World Health Organization, Madagascar recorded an estimated 2.2 million cases of malaria including 5 350 deaths in 2018 [33]. Climate change is likely to have an impact on the geographic range of vector-borne diseases: In Madagascar, malaria usually does not occur above 1 500 m [34]. However, temperature increases could expand occurrence to higher-lying areas. This is already the case in Antananarivo which used to be largely free of malaria but is now observing rising numbers of cases [35]. Malaria is also likely to increase in many parts of Madagascar due to flooding and stagnant waters, which provide a breeding ground for mosquitos [35]. Climate change also poses a threat to food security and malnutrition, particularly for subsistence farmers. Chronic malnutrition is generally high with 42 % and could further increase due to the consequences of the COVID-19 pandemic [36]. Furthermore, access to healthcare is often complicated in Madagascar: 40 % of the population live in areas far away from health centers and have to travel for hours to seek medical treatment [35]. Access is even more difficult in the rainy season when many rural areas are cut off by impassable roads.

Exposure to heatwaves

Figure 18: Projections of population exposure to heatwaves at least once a year for Madagascar for different GHG emissions scenarios.

Rising temperatures will result in more frequent heatwaves in Madagascar, leading to increased heat-related mortality. Under RCP6.0, the population affected by at least one heatwave per year is projected to increase from 0.2 % in 2000 to 4.8 % in 2080 (Figure 18).

Heat-related mortality

Figure 19: Projections of heat-related mortality for Madagascar for different GHG emissions scenarios assuming no adaptation to increased heat.

Furthermore, under RCP6.0, heat-related mortality will likely increase from 1.3 to 5.4 deaths per 100 000 people per year by 2080. This translates to an increase by a factor of more than four towards the end of the century compared to year 2000 levels, provided that no adaptation to hotter conditions will take place (Figure 19). Under RCP2.6, heat-related mortality is projected to increase to 2.9 deaths per 100 000 people per year in 2080.

References

[32] Ministère de la Santé Publique Madagascar, “Politique nationale de santé,” Antananarivo, Madagascar, 2016.
[33] WHO, “World Malaria Report 2019,” Rome, Italy, 2019.
[34] U.S. President’s Malaria Initiative, “Madagascar: Malaria Operational Plan FY 2017,” Washington, D.C., 2017.
[35] S. Barmania, “Madagascar’s Health Challenges,” Lancet, vol. 386, pp. 729–730, 2015.
[36] WFP, “Madagascar Country Brief August 2020,” Rome, Italy, 2020.

Madagascar: Ecosystems

Climate change is expected to have a significant influence on the ecology and distribution of tropical ecosystems, though the magnitude, rate and direction of these changes are uncertain [28]. With rising temperatures and increased frequency and intensity of droughts, wetlands and riverine systems are increasingly at risk of being disrupted and altered, with structural changes in plant and animal populations. Increased temperatures and droughts can also impact succession in forest systems while concurrently increasing the risk of invasive species, all of which affect ecosystems. In addition to these climate drivers, low agricultural productivity and population growth might motivate unsustainable agricultural practices resulting in increased deforestation, fires and soil erosion. In turn, soil erosion, along with heavy precipitation and storms, facilitate the occurrence of landslides, threatening human lives, infrastructure and natural resources [29].

Species richness

Figure 16: Projections of the aggregate number of amphibian, bird and mammal species for Madagascar for different GHG emissions scenarios.

Model projections of species richness (including amphibians, birds and mammals) and tree cover for Madagascar are shown in Figure 16 and 17, respectively. The models applied for this analysis show particularly strong agreement on the development of species richness: Under RCP6.0, species richness is expected to decrease almost all over Madagascar, in some parts by up to 50 % (Figure 16). Under RCP2.6, models are far less certain, projecting slight increases in small patches across Madagascar.

Tree cover

Figure 17: Tree cover projections for Madagascar for different GHG emissions scenarios.

With regard to tree cover, model results are very uncertain and only small changes are projected under both RCPs (Figure 17). Hence, no clear tree cover trends can be identified.

It is important to keep in mind that the model projections exclude any impacts on biodiversity loss from human activities such as land use, which have been responsible for significant losses of global biodiversity in the past, and are expected to remain its main driver in the future [30]. In recent years, Madagascar’s vegetation has experienced profound disturbances due to population pressure and increasing demand for firewood as well as agricultural land, leading to high rates of slash-and-burn activities, which are one of the main drivers behind deforestation [17]. The country has lost 3.89 million ha of tree cover between 2001 and 2019, which is equivalent to a 23 % decrease of national forest area [31].

References

[17] J. Busch et al., “Climate Change and the Cost of Conserving Species in Madagascar,” Conserv. Biol., vol. 26, no. 3, pp. 408–419, 2012, doi: 10.1111/j.1523-1739.2012.01838.x.
[29] V. J. Ramasiarinoro, L. Andrianaivo, and E. Rasolomanana, “Landslides and Associated Mass Movements Events in the Eastern Part of Madagascar: Risk Assessment, Land-Use Planning, Mitigation Measures and Further Strategies,” Madamines, vol. 4, pp. 28–41, 2012.
[30] IPBES, “Report of the Plenary of the Intergovernmental Science-Policy Platform on Biodiversity and Ecosystem Services on the Work of Its Seventh Session,” n.p., 2019.
[31] Global Forest Watch, “Madagascar,” 2019. Online available: www.globalforestwatch.org [Accessed: Sep. 28, 2020].

Madagascar: Infrastructure

Climate change is expected to significantly affect Madagascar’s infrastructure through extreme weather events. High precipitation amounts can lead to the flooding of roads, while high temperatures can cause roads, bridges and coastal infrastructures to develop cracks and degrade more quickly. This will require earlier replacement and lead to higher maintenance and replacement costs. The poorly developed railway network and limited inland waterway transportation increase Madagascar’s reliance on road transportation [24]. Roads, however, are in very poor condition with the majority being unpaved and difficult to access, especially during the rainy season. With an estimated road network of 31 640 km, Madagascar has one of the lowest road densities in the world [24]. Investments will have to be made to build climate-resilient road networks.

Extreme weather events also have devastating effects on human settlements and economic production sites, especially in urban areas with high population densities like Antananarivo, Toamasina or Antsirabe. Informal settlements are particularly vulnerable to extreme weather events: Makeshift homes are often built in unstable geographical locations including steep slopes or riverbanks, where strong winds and flooding can lead to loss of housing, contamination of water, injury or death. Dwellers usually have a low adaptive capacity to respond to such events due to high levels of poverty and lack of risk-reducing infrastructures. For example, the tropical Cyclone Belna made landfall on the north-western coast of Madagascar in December 2019, affecting 128 000 people [8]. The district of Soalala was hit particularly hard, recording damages to roads, electricity posts and wells [25]. Flooding and droughts will also have an impact on hydropower generation: Madagascar draws 29 % of its energy from hydropower, with a total installed capacity of 162 MW in 2014 [26]. However, variability in precipitation and climatic conditions could severely disrupt hydropower generation.

Despite the risk of infrastructure damage being likely to increase due to climate change, precise predictions of the location and the extent of exposure are difficult to make. For example, projections of river flood events are subject to substantial modelling uncertainty, largely due to the uncertainty of future projections of precipitation amounts and their spatial distribution, affecting flood occurrence (see also Figure 4). In the case of Madagascar, median projections show little change in national road exposure to river floods (Figure 13). In the year 2000, 1.6 % of major roads were exposed to river floods at least once a year. By 2080, this value is projected to not change under RCP6.0 and to increase to 2.0 % under RCP2.6. This difference is in line with precipitation trends for Madagascar. The exposure of urban land area to river floods is projected to change only slightly under both RCP (Figure 14).

Figure 13: Projections of major roads exposed to river floods at least once a year for Madagascar for different GHG emissions scenarios.
Figure 14: Projections of urban land area exposed to river floods at least once a year for Madagascar for different GHG emissions scenarios.

With the exposure of the GDP to heatwaves projected to increase from around 0.3 % in 2000 to 2.4 % (RCP2.6) and 4.8 % (RCP6.0) by 2080 (Figure 15), it is recommended that policy planners start identifying heat-sensitive economic production sites and activities, and integrating climate adaptation strategies such as improved solar-powered cooling systems, “cool roof” isolation materials or switching the operating hours from day to night [27].

Figure 15: Exposure of GDP in Madagascar to heatwaves for different GHG emissions scenarios.

References

[24] Logistics Cluster and WFP, “Madagascar Logistics Infrastructure.” Online available: https://dlca.logcluster.org/display/public/DLCA/2+Madagascar+Logistics+Infrastructure [Accessed: Sep. 30, 2020].
[25] OCHA, “Southern Africa: Cyclone Belna (Flash Update No. 5),” New York, 2019.
[26] World Bank, “Small Hydropower Resource Mapping in Madagascar: Hydropower Atlas,” Washington, D.C., 2017.
[27] M. Dabaieh, O. Wanas, M. A. Hegazy, and E. Johansson, “Reducing Cooling Demands in a Hot Dry Climate: A Simulation Study for Non-Insulated Passive Cool Roof Thermal Performance in Residential Buildings,” Energy Build., vol. 89, pp. 142–152, 2015, doi: 10.1016/j.enbuild.2014.12.034.

Madagascar: Agriculture

Smallholder farmers in Madagascar are increasingly challenged by the uncertainty and variability of weather caused by climate change [21]. Since crops are predominantly rainfed, yields highly depend on water availability from precipitation and are prone to drought. Both the length and the intensity of the rainy season are becoming more and more unpredictable and the availability and use of irrigation facilities remains limited: In 2013, only 60 % of the estimated irrigation potential of 1.5 million ha (42 % of total national crop land) was equipped for irrigation [9]. Constraints to the implementation of adaptation strategies usually include limited access to technical equipment, formal credit and extension services [21]. The main irrigated crop is rice, and while temperature increases could be beneficial where low temperatures are currently a limiting factor to the growth of rice, prolonged periods of high temperatures in combination with strong winds could as well have devastating impacts on rice yields [22], [23]. Drier conditions also facilitate the spread of invasive species including the fall armyworm, which caused a yield loss of 47 % for maize in Madagascar in 2018 [8].

Crop land exposure to drought

Figure 11: Projections of crop land area exposed to drought at least once a year for Madagascar for different GHG emissions scenarios.

Currently, the high uncertainty of projections regarding water availability (Figure 10) translates into high uncertainty of drought projections (Figure 11). According to the median over all models employed for this analysis, the national crop land area exposed to at least one drought per year will increase from 0.4 % in 2000 to 1.4 % and 2.6 % in 2080 under RCP2.6 and RCP6.0, respectively. Under RCP6.0, the likely range of drought exposure of the national crop land area per year widens from 0.04–0.8 % in 2000 to 0.9–6.5 % in 2080. The very likely range widens from 0–1.4 % in 2000 to 0.4–9 % in 2080. This means that some models project a tenfold increase of drought exposure over this time period.

Crop yield projections

Figure 12: Projections of crop yield changes for major staple crops in Madagascar for different GHG emissions scenarios assuming constant land use and agricultural management, relative to the year 2000.

In terms of yield projections, model results indicate a negative trend for cassava and maize under both RCPs (Figure 12)6. By 2080, compared to the year 2000, yields of cassava and maize are projected to decrease by 3.8 % and 2.7 % under RCP2.6, and by 2.6 % and 2.8 % under RCP6.0. Yields of rice and sugar cane, on the other hand, are projected to increase by 2.7 % and 9.7 % under RCP6.0 and to not change under RCP2.6. A possible explanation for the more positive results under RCP6.0 is that rice, sugar cane and cassava are so-called C3 plants, which follow a different metabolic pathway than, for example, maize (a C4 plant), and benefit more from the CO2 fertilisation effect under higher concentration pathways. The later drop for cassava can be explained by decreasing levels of precipitation after 2050 under RCP6.0 (see Figure 5). Although some yield changes may appear small at the national level, they will likely increase more strongly in some areas and, conversely, decrease more strongly in other areas as a result of climate change impacts.

Overall, adaptation strategies such as switching to improved varieties in climate change sensitive crops need to be considered, yet should be carefully weighed against adverse outcomes, such as a resulting decline of agro-biodiversity and loss of local crop types.

6 Modelling data is available for a selected number of crops only. Hence, the crops listed on page 2 may differ.

References

[8] FEWS NET, “Madagascar Food Security Outlook: February to September 2020,” n.p., 2020.
[9] FAO, “AQUASTAT Main Database: Irrigation and Drainage Development.” Online available: http://www.fao.org/nr/water/aquastat/data/query/index.html?lang=en [Accessed: Dec. 07, 2020].
[21] C. A. Harvey et al., “Extreme Vulnerability of Smallholder Farmers to Agricultural Risks and Climate Change in Madagascar,” Philos. Trans. R. Soc. B Biol. Sci., vol. 369, no. 1639, 2014, doi: 10.1098/rstb.2013.0089.
[22] E. Gerardeaux, M. Giner, A. Ramanantsoanirina, and J. Dusserre, “Positive Effects of Climate Change on Rice in Madagascar,” Agron. Sustain. Dev., vol. 32, no. 3, pp. 619–627, 2012, doi: 10.1007/s13593-011-0049-6.
[23] AQUASTAT, Irrigation in Africa in Figures. Rome, Italy: FAO, 2005.

Madagascar: Water resources

Madagascar is known for its abundant water resources from precipitation. However, these water resources are unevenly distributed across the country. While parts of the eastern coast of Madagascar receive more than 3,300 mm of precipitation annually, the south-west receives as little as 400 mm and is characterised by a semi-arid to arid climate [18]. For instance, in the 2019 / 2020 rainy season, the very south-west of the country, particularly northern Amboasary and parts of Ambovombe, Tsihombe and Bekily, recorded below-average precipitation levels, threatening agricultural crops which were just sown or at the flowering stage [8]. In contrast, northern Madagascar recorded above-average precipitation levels, which resulted in flooding in several regions, including Alaotra Mangoro, Analamanga, Betsiboka, Boeny, Melaky, and Sofia [19]. Increasingly heavy precipitation events and cyclones already have devastating impacts on smallholder farmers. In a study conducted among smallholder farmers in the aftermath of the 2012 cyclone Giovanna, 81 % of farmers reported losing crops and 70 % reported damages to stored grains, resulting in prolonged periods with insufficient food for household consumption [20].

Per capita water availability

Figure 9: Projections of water availability from precipitation per capita and year with (A) national population held constant at year 2000 level and (B) changing population in line with SSP2 projections for different GHG emissions scenarios, relative to the year 2000.

Current projections of water availability in Madagascar display high uncertainty under both GHG emissions scenarios. Assuming a constant population level, multi-model median projections suggest a decrease of 13 % (RCP2.6) and 15 % (RCP6.0) in per capita water availability by the end of the century (Figure 9A). Yet, when accounting for population growth according to SSP2 projections5, per capita water availability for Madagascar is projected to decline more dramatically, i.e. by 78 % under both RCPs by 2080 relative to the year 2000 (Figure 9B). While this decline is primarily driven by population growth rather than climate change, it highlights the urgency to invest in water saving measures and technologies for future water consumption after 2030.

Spatial distribution of water availability

Figure 10: Water availability from precipitation (runoff) projections for Madagascar for different GHG emissions scenarios.

Projections of future water availability from precipitation vary depending on the region and scenario (Figure 10). In line with precipitation projections, water availability is projected to decrease by up to 25 % in the north and east of Madagascar under RCP6.0. Under RCP2.6, models project decreases of up to 20 % for the north-east with simultaneous increases of up to 40 % in the otherwise very dry south-west of the country. The partial increase in water availability projected under RCP2.6 is based on a constant population level. Hence, water saving measures are likely to become important for Madagascar’s rapidly growing population.

5 Shared Socio-economic Pathways (SSPs) outline a narrative of potential global futures, including estimates of broad characteristics such as country level population, GDP or rate of urbanisation. Five different SSPs outline future realities according to a combination of high and low future socio-economic challenges for mitigation and adaptation. SSP2 represents the “middle of the road”-pathway.

References

[18] S. Lange, “EartH2Observe, WFDEI and ERA-Interim Data Merged and Bias-Corrected for ISIMIP (EWEMBI).” GFZ Data Service, Potsdam, Germany, 2016, doi: 10.5880/pik.2016.004.
[19] NASA Earth Observatory, “Flood Waters Overwhelm Northern Madagascar,” 2020. Online available: https://earthobservatory.nasa.gov/images/146225/flood-waters-overwhelm-northern-madagascar [Accessed: Sep. 28, 2020].
[20] Z. L. Rakotobe et al., “Strategies of Smallholder Farmers for Coping with the Impacts of Cyclones: A Case Study from Madagascar,” Int. J. Disaster Risk Reduct., vol. 17, pp. 114–122, 2016, doi: 10.1016/j.ijdrr.2016.04.013.

Madagascar: Climate

Temperature

Figure 2: Air temperature projections for Madagascar for different GHG emissions scenarios.4

In response to increasing greenhouse gas (GHG) concentrations, air temperature over Madagascar is projected to rise by 1.5 to 3.2 °C (very likely range) by 2080 relative to the year 1876, depending on the future GHG emissions scenario (Figure 2). Compared to pre-industrial levels, median climate model temperature increases over Madagascar amount to approximately 1.6 °C in 2030 and 1.8 °C in both 2050 and 2080 under the low emissions scenario RCP2.6. Under the medium / high emissions scenario RCP6.0, median climate model temperature increases amount to 1.5 °C in 2030, 2.0 °C in 2050 and 2.8 °C in 2080.

Very hot days

Figure 3: Projections of the annual number of very hot days (daily maximum temperature above 35 °C) for Madagascar for different GHG emissions scenarios.

In line with rising mean annual temperatures, the annual number of very hot days (days with daily maximum temperature above 35 °C) is projected to rise substantially and with high certainty, in particular over western Madagascar (Figure 3). Under the medium / high emissions scenario RCP6.0, the multi-model median, averaged over the whole country, projects 5 more very hot days per year in 2030 than in 2000, 8 more in 2050 and 24 more in 2080. In some parts, especially on the western coast of Madagascar, this amounts to about 90 days per year by 2080.

Sea level rise

Figure 4: Projections for sea level rise off the coast of Madagascar for different GHG emissions scenarios, relative to the year 2000.

In response to globally increasing temperatures, the sea level off the coast of Madagascar is projected to rise (Figure 4). Until 2050, very similar sea levels are projected under both emissions scenarios. Under RCP6.0 and compared to year 2000 levels, the median climate model projects a sea level rise by 11 cm in 2030, 22 cm in 2050, and 43 cm in 2080. This threatens Madagascar’s coastal communities and may cause saline intrusion in coastal waterways and groundwater reservoirs.

Precipitation

Figure 5: Annual mean precipitation projections for Madagascar for different GHG emissions scenarios, relative to the year 2000.

Future projections of precipitation are less certain than projections of temperature change due to high natural year-to-year variability (Figure 5). Out of the four climate models underlying this analysis, two models project a decrease in mean annual precipitation over Madagascar and two models project little change. Median model projections show a precipitation decrease of 114 mm per year by 2080 under RCP6.0, while median model projections for RCP2.6 show a decrease at the beginning of the century, which settles at a decrease of 47 mm by 2080 compared to year 2000. Higher greenhouse gas emissions suggest an overall drier future for Madagascar.

Heavy precipitation events

Figure 6: Projections of the number of days with heavy precipitation over Madagascar for different GHG emissions scenarios, relative to the year 2000.

In response to global warming, heavy precipitation events are expected to become more intense in many parts of the world due to the increased water vapour holding capacity of a warmer atmosphere. At the same time, the number of days with heavy precipitation events is expected to increase. This tendency is also reflected in climate projections for Madagascar (Figure 6), with climate models projecting a slight increase in the number of days with heavy precipitation events, from 7.0 days per year in 2000 to 7.5 and 7.2 days per year in 2080 under RCP2.6 and RCP6.0, respectively.

Soil moisture

Figure 7: Soil moisture projections for Madagascar for different GHG emissions scenarios, relative to the year 2000.

Soil moisture is an important indicator for drought conditions. In addition to soil parameters and management, it depends on both precipitation and temperature, as higher temperatures translate to higher potential evapotranspiration. Projections for annual mean soil moisture values for the topsoil (from the surface to a depth of 1 metre) show a slight decrease under RCP2.6 and a stronger decrease of 5 % under RCP6.0 by 2080 compared to the year 2000 (Figure 7). However, looking at the different models underlying this analysis, there is large year-to-year variability and modelling uncertainty, with some models projecting a much stronger decrease in soil moisture.

Potential evapotranspiration

Figure 8: Potential evapotranspiration projections for Madagascar for different GHG emissions scenarios, relative to the year 2000.

Potential evapotranspiration is the amount of water that would be evaporated and transpired if sufficient water was available at and below land surface. Since warmer air can hold more water vapour, it is expected that global warming will increase potential evapotranspiration in most regions of the world. In line with this expectation, hydrological projections for Madagascar indicate a stronger rise of potential evapotranspiration under RCP6.0 than under RCP2.6 (Figure 8). Under RCP6.0, potential evapotranspiration is projected to increase by 3 % in 2030, 4 % in 2050 and 8 % in 2080 compared to year 2000 levels.

4 Changes are expressed relative to year 1876 temperature levels using the multi-model median temperature change from 1876 to 2000 as a proxy for the observed historical warming over that time period.