Climate change threatens the health and sanitation sector through more frequent incidences of heatwaves, floods, droughts and storms. Among the key health challenges in Mauritania are morbidity and mortality through vector-borne diseases such as malaria, waterborne diseases related to extreme weather events (e.g. flooding) such as diarrhoea and cholera, as well as tuberculosis, HIV and respiratory diseases [29]. Climate change is also likely to impact food and water supply, thereby increasing the risk of malnutrition, hunger and death by famine. Many of these challenges are expected to become more severe under climate change. According to the World Health Organization (WHO), Mauritania recorded around 174 000 cases of malaria in 2018 [30]. Climate change is likely to have an impact on malaria transmission periods and the geographic range of vector-borne diseases: In Mauritania, the general malaria risk is projected to fall due to rising temperatures [31]. However, some regions are likely to become more vulnerable to malaria, for instance, due to more frequent incidences of flooding [32]. Climate change also poses a threat to food security and malnutrition, particularly for subsistence farmers. While chronic malnutrition is generally high at 19.6 %, it could further increase due to the consequences of the COVID-19 pandemic [33]. According to the WHO, more than 900 000 people faced food insecurity in June 2020, which is an increase of 48 % within six months [33].
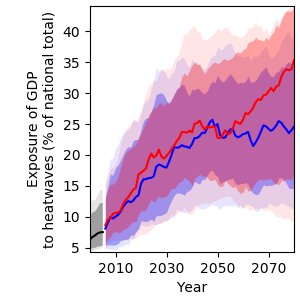
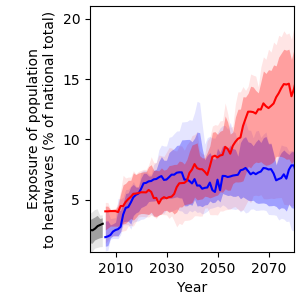
Exposure to heatwaves
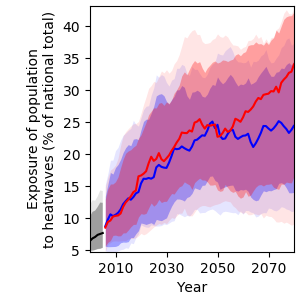
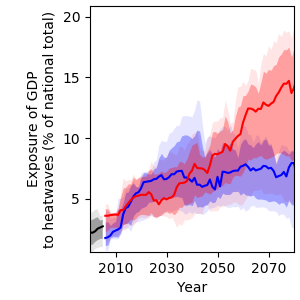
Rising temperatures will result in more frequent heatwaves in Mauritania, leading to increased heat-related mortality. Under RCP6.0, the population affected by at least one heatwave per year is projected to increase from 6 % in 2000 to 34 % in 2080 (Figure 18).
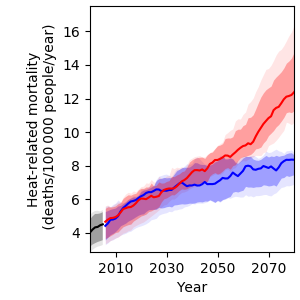
Heat-related mortality
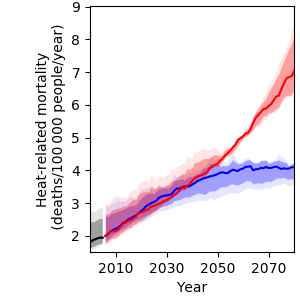
Furthermore, under RCP6.0, heat-related mortality will likely increase from about 2 to about 7 deaths per 100 000 people per year by 2080, which translates to an increase by a factor of more than three towards the end of the century compared to year 2000 levels, provided that no adaptation to hotter conditions will take place (Figure 19). Under RCP2.6, heat-related mortality is projected to increase to about 4 deaths per 100 000 people per year in 2080.
References
[29] Republique Islamique de Mauritanie, “Rapport d’analyse de situation du secteur de la santé,” Nouakchott, Mauritania, 2011.
[30] WHO, “World Malaria Report 2019,” Rome, Italy, 2019.
[31] C. Caminade, A. E. Jones, R. Ross, and G. Macdonald, “Malaria in a Warmer West Africa,” Nat. Clim. Chang., vol. 6, no. November, pp. 984–985, 2016.
[32] R. Boyce, R. Reyes, M. Matte, M. Ntaro, E. Mulogo, J. P. Metlay, L. Band, and M. J. Siedner, “Severe Flooding and Malaria Transmission in the Western Ugandan Highlands: Implications for Disease Control in an Era of Global Climate Change,” J. Infect. Dis., vol. 214, pp. 1403–1410, 2016.
[33] WFP, “Mauritania Country Brief: June 2020,” Rome, Italy, 2020.