Smallholder farmers in Madagascar are increasingly challenged by the uncertainty and variability of weather caused by climate change [21]. Since crops are predominantly rainfed, yields highly depend on water availability from precipitation and are prone to drought. Both the length and the intensity of the rainy season are becoming more and more unpredictable and the availability and use of irrigation facilities remains limited: In 2013, only 60 % of the estimated irrigation potential of 1.5 million ha (42 % of total national crop land) was equipped for irrigation [9]. Constraints to the implementation of adaptation strategies usually include limited access to technical equipment, formal credit and extension services [21]. The main irrigated crop is rice, and while temperature increases could be beneficial where low temperatures are currently a limiting factor to the growth of rice, prolonged periods of high temperatures in combination with strong winds could as well have devastating impacts on rice yields [22], [23]. Drier conditions also facilitate the spread of invasive species including the fall armyworm, which caused a yield loss of 47 % for maize in Madagascar in 2018 [8].
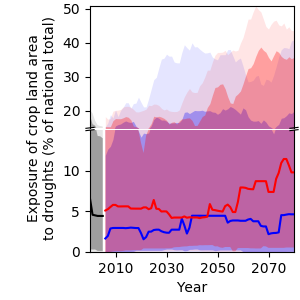
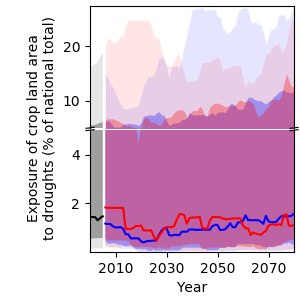
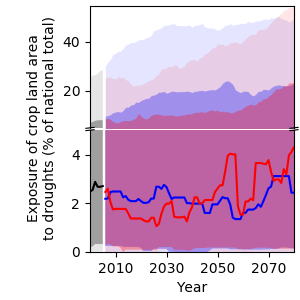
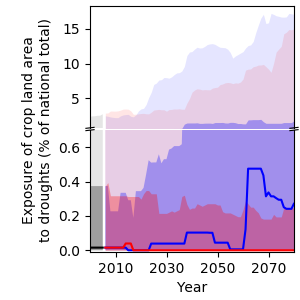
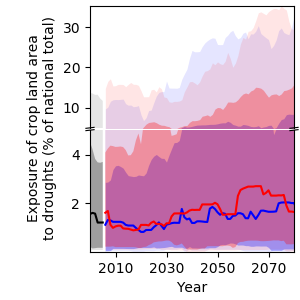
Crop land exposure to drought
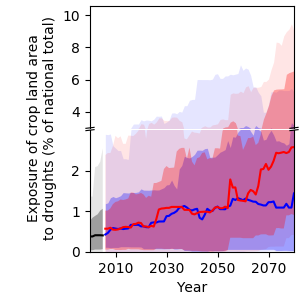
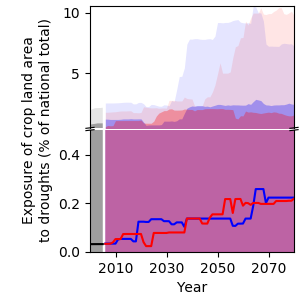
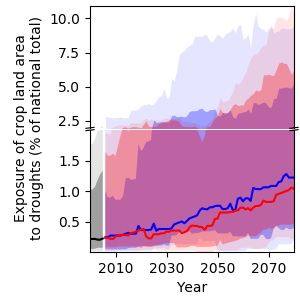
Currently, the high uncertainty of projections regarding water availability (Figure 10) translates into high uncertainty of drought projections (Figure 11). According to the median over all models employed for this analysis, the national crop land area exposed to at least one drought per year will increase from 0.4 % in 2000 to 1.4 % and 2.6 % in 2080 under RCP2.6 and RCP6.0, respectively. Under RCP6.0, the likely range of drought exposure of the national crop land area per year widens from 0.04–0.8 % in 2000 to 0.9–6.5 % in 2080. The very likely range widens from 0–1.4 % in 2000 to 0.4–9 % in 2080. This means that some models project a tenfold increase of drought exposure over this time period.
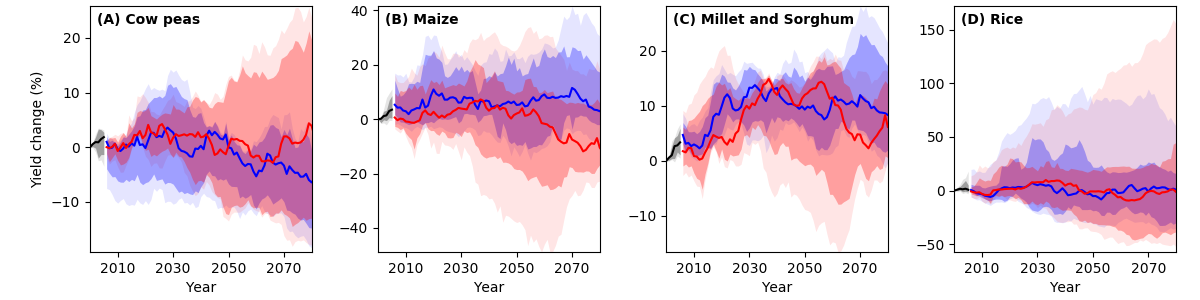
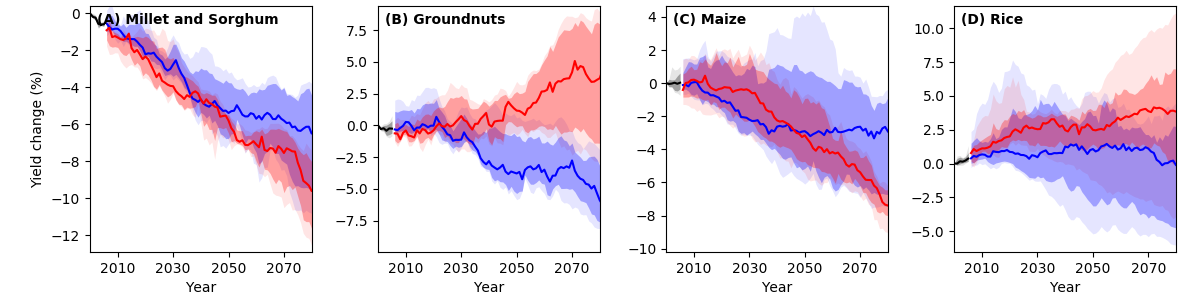
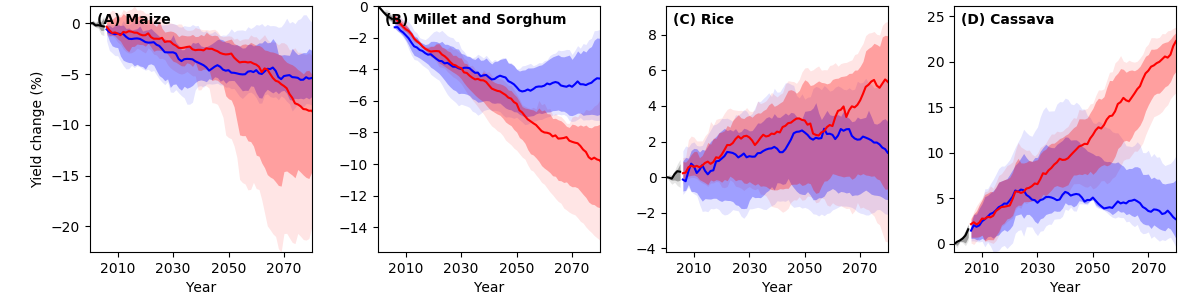
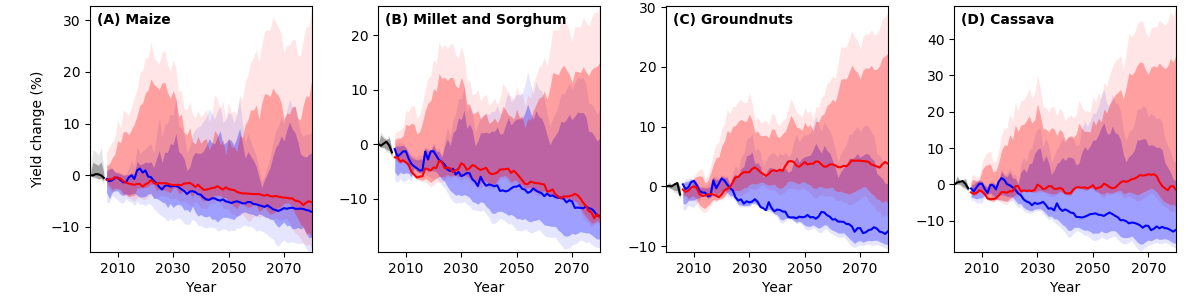
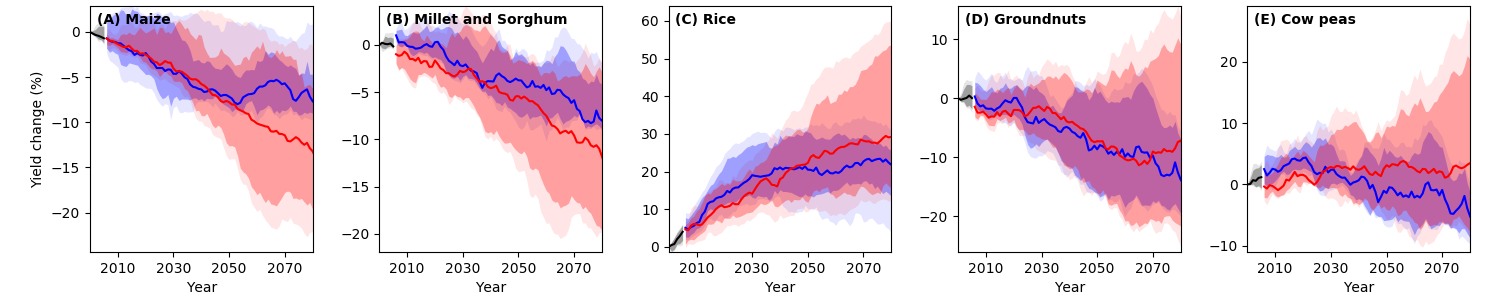
Crop yield projections
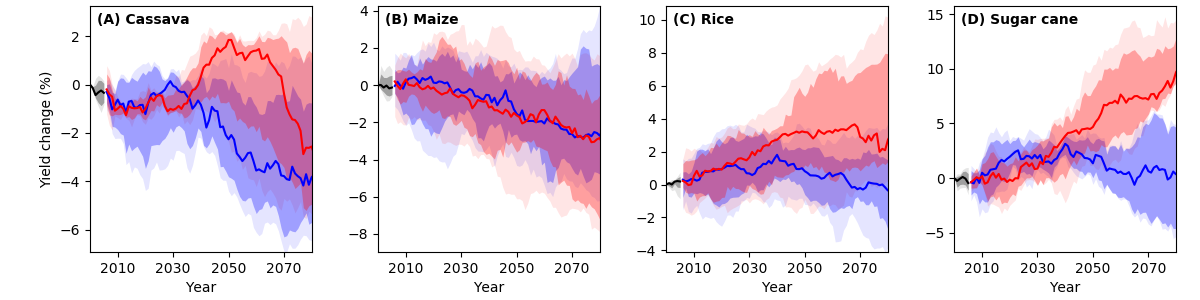
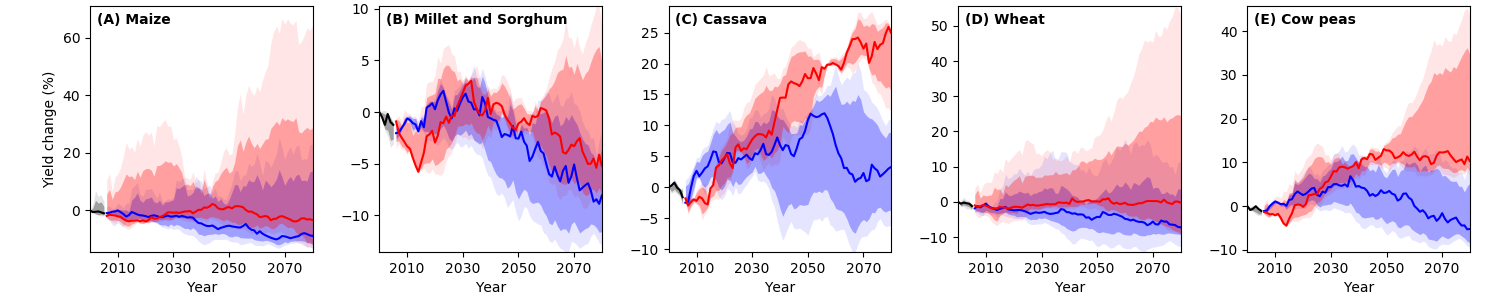
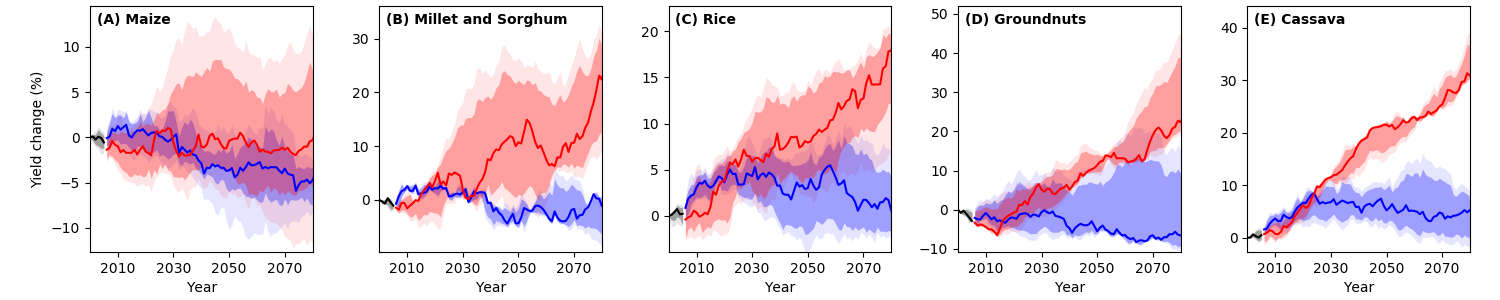
In terms of yield projections, model results indicate a negative trend for cassava and maize under both RCPs (Figure 12)6. By 2080, compared to the year 2000, yields of cassava and maize are projected to decrease by 3.8 % and 2.7 % under RCP2.6, and by 2.6 % and 2.8 % under RCP6.0. Yields of rice and sugar cane, on the other hand, are projected to increase by 2.7 % and 9.7 % under RCP6.0 and to not change under RCP2.6. A possible explanation for the more positive results under RCP6.0 is that rice, sugar cane and cassava are so-called C3 plants, which follow a different metabolic pathway than, for example, maize (a C4 plant), and benefit more from the CO2 fertilisation effect under higher concentration pathways. The later drop for cassava can be explained by decreasing levels of precipitation after 2050 under RCP6.0 (see Figure 5). Although some yield changes may appear small at the national level, they will likely increase more strongly in some areas and, conversely, decrease more strongly in other areas as a result of climate change impacts.
Overall, adaptation strategies such as switching to improved varieties in climate change sensitive crops need to be considered, yet should be carefully weighed against adverse outcomes, such as a resulting decline of agro-biodiversity and loss of local crop types.
6 Modelling data is available for a selected number of crops only. Hence, the crops listed on page 2 may differ.
References
[8] FEWS NET, “Madagascar Food Security Outlook: February to September 2020,” n.p., 2020.
[9] FAO, “AQUASTAT Main Database: Irrigation and Drainage Development.” Online available: http://www.fao.org/nr/water/aquastat/data/query/index.html?lang=en [Accessed: Dec. 07, 2020].
[21] C. A. Harvey et al., “Extreme Vulnerability of Smallholder Farmers to Agricultural Risks and Climate Change in Madagascar,” Philos. Trans. R. Soc. B Biol. Sci., vol. 369, no. 1639, 2014, doi: 10.1098/rstb.2013.0089.
[22] E. Gerardeaux, M. Giner, A. Ramanantsoanirina, and J. Dusserre, “Positive Effects of Climate Change on Rice in Madagascar,” Agron. Sustain. Dev., vol. 32, no. 3, pp. 619–627, 2012, doi: 10.1007/s13593-011-0049-6.
[23] AQUASTAT, Irrigation in Africa in Figures. Rome, Italy: FAO, 2005.