Climate change is expected to significantly affect Madagascar’s infrastructure through extreme weather events. High precipitation amounts can lead to the flooding of roads, while high temperatures can cause roads, bridges and coastal infrastructures to develop cracks and degrade more quickly. This will require earlier replacement and lead to higher maintenance and replacement costs. The poorly developed railway network and limited inland waterway transportation increase Madagascar’s reliance on road transportation [24]. Roads, however, are in very poor condition with the majority being unpaved and difficult to access, especially during the rainy season. With an estimated road network of 31 640 km, Madagascar has one of the lowest road densities in the world [24]. Investments will have to be made to build climate-resilient road networks.
Extreme weather events also have devastating effects on human settlements and economic production sites, especially in urban areas with high population densities like Antananarivo, Toamasina or Antsirabe. Informal settlements are particularly vulnerable to extreme weather events: Makeshift homes are often built in unstable geographical locations including steep slopes or riverbanks, where strong winds and flooding can lead to loss of housing, contamination of water, injury or death. Dwellers usually have a low adaptive capacity to respond to such events due to high levels of poverty and lack of risk-reducing infrastructures. For example, the tropical Cyclone Belna made landfall on the north-western coast of Madagascar in December 2019, affecting 128 000 people [8]. The district of Soalala was hit particularly hard, recording damages to roads, electricity posts and wells [25]. Flooding and droughts will also have an impact on hydropower generation: Madagascar draws 29 % of its energy from hydropower, with a total installed capacity of 162 MW in 2014 [26]. However, variability in precipitation and climatic conditions could severely disrupt hydropower generation.
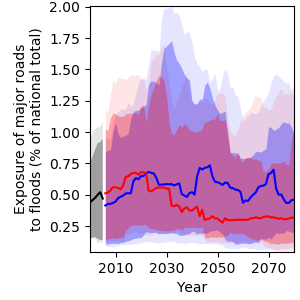
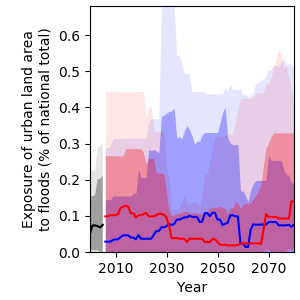
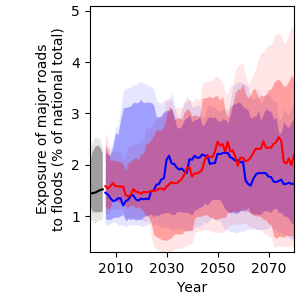
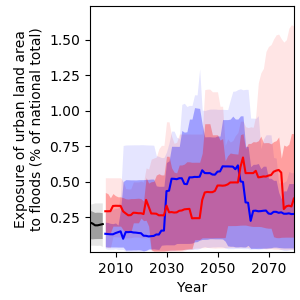
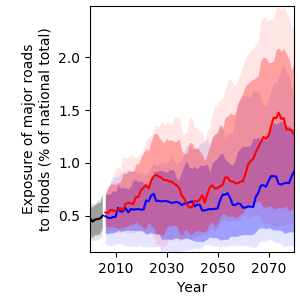
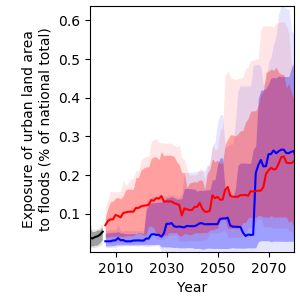
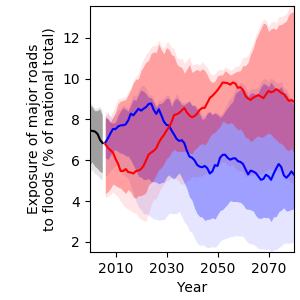
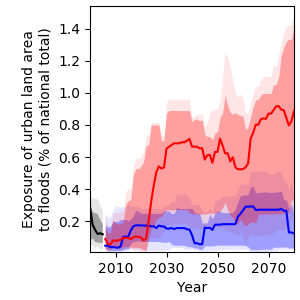
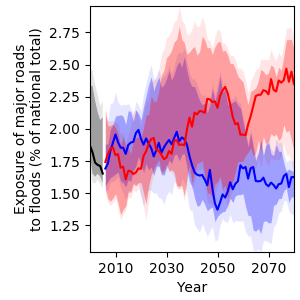
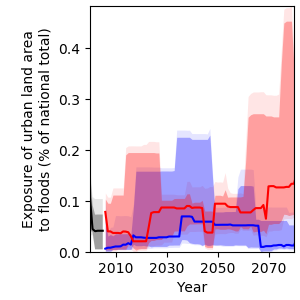
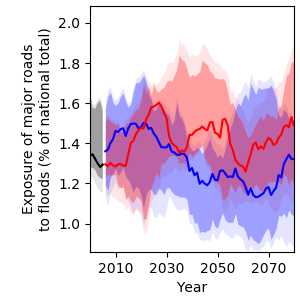
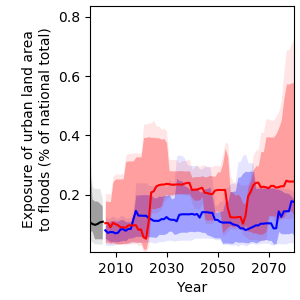
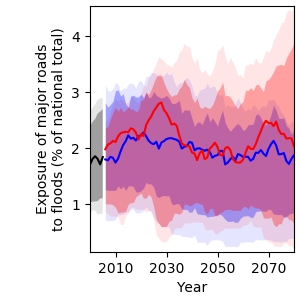
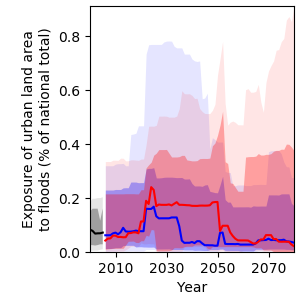
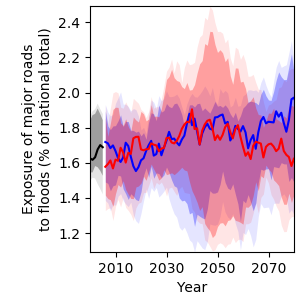
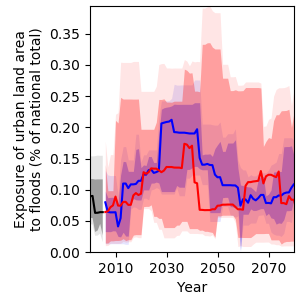
Despite the risk of infrastructure damage being likely to increase due to climate change, precise predictions of the location and the extent of exposure are difficult to make. For example, projections of river flood events are subject to substantial modelling uncertainty, largely due to the uncertainty of future projections of precipitation amounts and their spatial distribution, affecting flood occurrence (see also Figure 4). In the case of Madagascar, median projections show little change in national road exposure to river floods (Figure 13). In the year 2000, 1.6 % of major roads were exposed to river floods at least once a year. By 2080, this value is projected to not change under RCP6.0 and to increase to 2.0 % under RCP2.6. This difference is in line with precipitation trends for Madagascar. The exposure of urban land area to river floods is projected to change only slightly under both RCP (Figure 14).
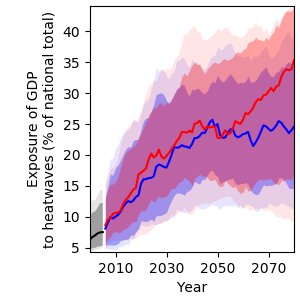
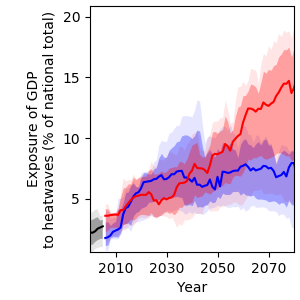
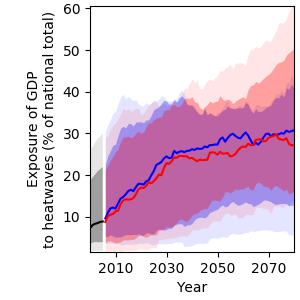
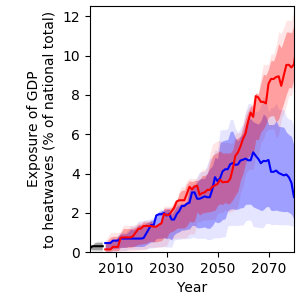
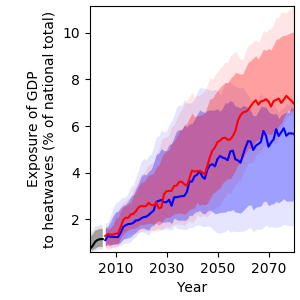
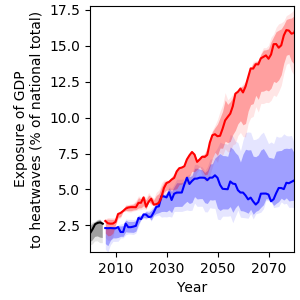
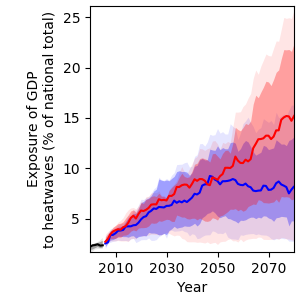
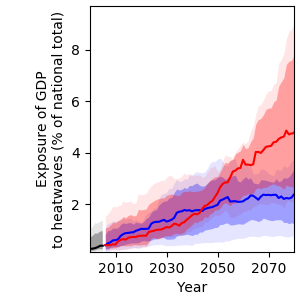
With the exposure of the GDP to heatwaves projected to increase from around 0.3 % in 2000 to 2.4 % (RCP2.6) and 4.8 % (RCP6.0) by 2080 (Figure 15), it is recommended that policy planners start identifying heat-sensitive economic production sites and activities, and integrating climate adaptation strategies such as improved solar-powered cooling systems, “cool roof” isolation materials or switching the operating hours from day to night [27].
References
[24] Logistics Cluster and WFP, “Madagascar Logistics Infrastructure.” Online available: https://dlca.logcluster.org/display/public/DLCA/2+Madagascar+Logistics+Infrastructure [Accessed: Sep. 30, 2020].
[25] OCHA, “Southern Africa: Cyclone Belna (Flash Update No. 5),” New York, 2019.
[26] World Bank, “Small Hydropower Resource Mapping in Madagascar: Hydropower Atlas,” Washington, D.C., 2017.
[27] M. Dabaieh, O. Wanas, M. A. Hegazy, and E. Johansson, “Reducing Cooling Demands in a Hot Dry Climate: A Simulation Study for Non-Insulated Passive Cool Roof Thermal Performance in Residential Buildings,” Energy Build., vol. 89, pp. 142–152, 2015, doi: 10.1016/j.enbuild.2014.12.034.