Madagascar is known for its abundant water resources from precipitation. However, these water resources are unevenly distributed across the country. While parts of the eastern coast of Madagascar receive more than 3,300 mm of precipitation annually, the south-west receives as little as 400 mm and is characterised by a semi-arid to arid climate [18]. For instance, in the 2019 / 2020 rainy season, the very south-west of the country, particularly northern Amboasary and parts of Ambovombe, Tsihombe and Bekily, recorded below-average precipitation levels, threatening agricultural crops which were just sown or at the flowering stage [8]. In contrast, northern Madagascar recorded above-average precipitation levels, which resulted in flooding in several regions, including Alaotra Mangoro, Analamanga, Betsiboka, Boeny, Melaky, and Sofia [19]. Increasingly heavy precipitation events and cyclones already have devastating impacts on smallholder farmers. In a study conducted among smallholder farmers in the aftermath of the 2012 cyclone Giovanna, 81 % of farmers reported losing crops and 70 % reported damages to stored grains, resulting in prolonged periods with insufficient food for household consumption [20].
Per capita water availability
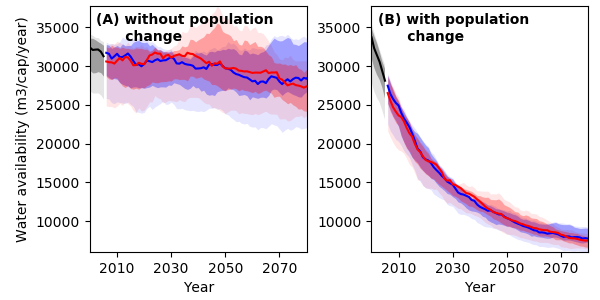
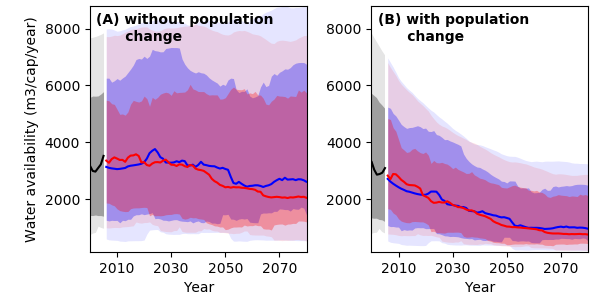
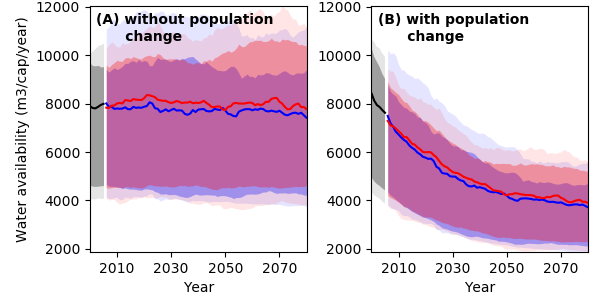
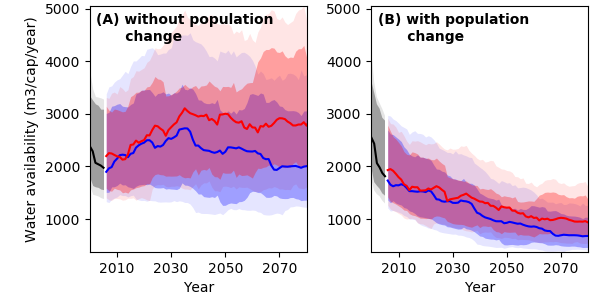
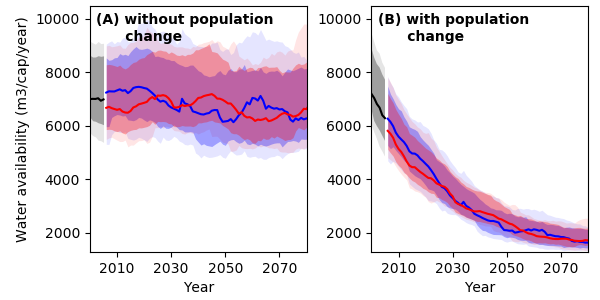
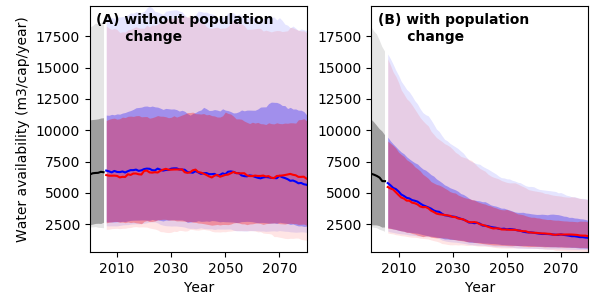
Current projections of water availability in Madagascar display high uncertainty under both GHG emissions scenarios. Assuming a constant population level, multi-model median projections suggest a decrease of 13 % (RCP2.6) and 15 % (RCP6.0) in per capita water availability by the end of the century (Figure 9A). Yet, when accounting for population growth according to SSP2 projections5, per capita water availability for Madagascar is projected to decline more dramatically, i.e. by 78 % under both RCPs by 2080 relative to the year 2000 (Figure 9B). While this decline is primarily driven by population growth rather than climate change, it highlights the urgency to invest in water saving measures and technologies for future water consumption after 2030.
Spatial distribution of water availability
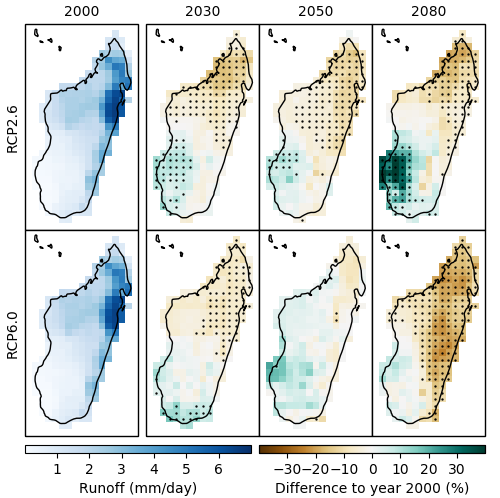
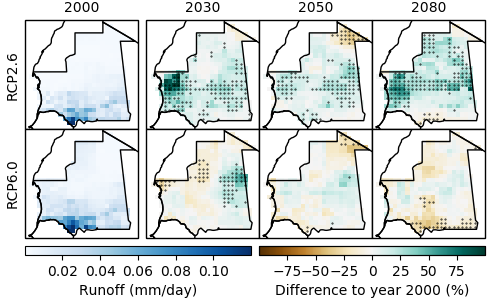
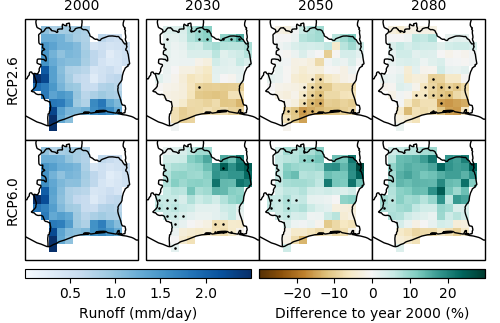
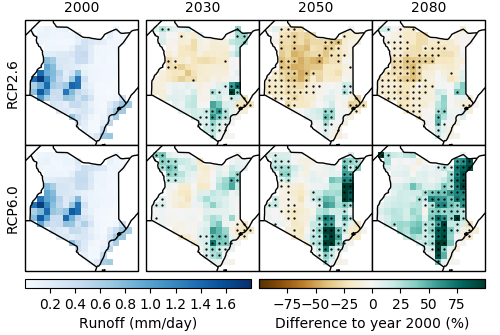
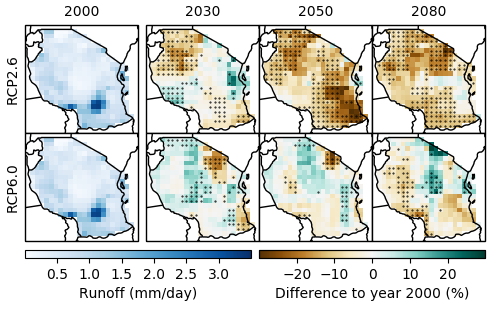
Projections of future water availability from precipitation vary depending on the region and scenario (Figure 10). In line with precipitation projections, water availability is projected to decrease by up to 25 % in the north and east of Madagascar under RCP6.0. Under RCP2.6, models project decreases of up to 20 % for the north-east with simultaneous increases of up to 40 % in the otherwise very dry south-west of the country. The partial increase in water availability projected under RCP2.6 is based on a constant population level. Hence, water saving measures are likely to become important for Madagascar’s rapidly growing population.
5 Shared Socio-economic Pathways (SSPs) outline a narrative of potential global futures, including estimates of broad characteristics such as country level population, GDP or rate of urbanisation. Five different SSPs outline future realities according to a combination of high and low future socio-economic challenges for mitigation and adaptation. SSP2 represents the “middle of the road”-pathway.
References
[18] S. Lange, “EartH2Observe, WFDEI and ERA-Interim Data Merged and Bias-Corrected for ISIMIP (EWEMBI).” GFZ Data Service, Potsdam, Germany, 2016, doi: 10.5880/pik.2016.004.
[19] NASA Earth Observatory, “Flood Waters Overwhelm Northern Madagascar,” 2020. Online available: https://earthobservatory.nasa.gov/images/146225/flood-waters-overwhelm-northern-madagascar [Accessed: Sep. 28, 2020].
[20] Z. L. Rakotobe et al., “Strategies of Smallholder Farmers for Coping with the Impacts of Cyclones: A Case Study from Madagascar,” Int. J. Disaster Risk Reduct., vol. 17, pp. 114–122, 2016, doi: 10.1016/j.ijdrr.2016.04.013.